Article
Determinants of CSA Adoption in Coastal Bangladesh: An Application of Structural Path Analysis
Md. Sumon Howlader 1,2 , Md. Mamun-Ur-Rashid 1, Md. Kamrul Hasan 1 and
Md. Ektear Uddin 1,*
, Md. Mamun-Ur-Rashid 1, Md. Kamrul Hasan 1 and
Md. Ektear Uddin 1,*
1 Department of
Agricultural Extension and Rural Development, Patuakhali Science and Technology
University,
Patuakhali 8660, Bangladesh; murashid@pstu.ac.bd (M.M.U.R.); kamrulext@pstu.ac.bd (M.K.H.)
2 Department of Agricultural Extension, Ministry of Agriculture, Dahka 1215, Bangladesh; sumonpstu10@gmail.com
* Correspondence: ektear@pstu.ac.bd
|
Citation: Howlader, M. S., Mamun-Ur-Rashid, M., Hasan,
M. K., & Uddin, M. E. (2026). Determinants of CSA
Received: 7 July 2026 Revised: 3 September 2026 Accepted: 8 September 2026 Published: 16 September 2026
Copyright: © 2026 by the authors. Licensee SCC Press, Kowloon, Hong Kong S.A.R., China. This article is an open access article distributed under the terms and conditions of the Creative Commons Attribution (CC BY) license. |


Abstract:
Climate-smart agriculture (CSA) is widely promoted to reconcile productivity, resilience, and emissions goals among smallholder farmers, yet adoption of capital-intensive CSA technologies remains low and uneven in climate-vulnerable coastal agriculture. This study examines socio-demographic, institutional, and behavioral determinants of CSA adoption among farming households in selected coastal districts of Bangladesh. This cross-sectional study interviewed 386 farmers from 3 selected coastal districts of Bangladesh following a multi-stage random sampling. Results were interpreted using descriptive statistics, Spearman’s correlation, adoption-difficulty (quadrant) analysis, and structural path analysis. Adoption levels varied widely across 30 CSA practices. Low-cost, knowledge-based practices such as raised bed homestead gardening, airtight seed storage, and heat and salinity-tolerant crops were widely adopted, whereas capital-intensive technologies such as poly-net houses, solar irrigation, and the sorjan method remained rare. Extension communication showed the strongest association with extension strategies for promoting CSA (β = 0.551), whereas strategies for promoting CSA, knowledge of CSA, and climate change perception were important predictors of CSA adoption. Importantly, the ICT usage had a negative relationship with climate change perception, indicating a digital paradox whereby the higher connectivity does not lead to a better understanding of the issues related to climate change. The research shows that there is a necessity for combined extension approaches based on face-to-face extension efforts, participatory learning platforms, and credible digital technologies combined with strong farmer organizations for increasing CSA adoption in coastal Bangladesh.Keywords:
climate-smart agriculture; structural equation modeling; path analysis; agricultural extension; coastal Bangladesh1. Introduction
Climate change is the most critical threats to global food security, and its effects are overwhelmingly felt in agrarian economies where agriculture remains extremely vulnerable to weather changes (Hasan et al., 2018; Lipper et al., 2014). The warming trend, change in rainfall patterns, and the occurrence of extreme weather phenomena are factors that have started changing how crops perform and decisions made at the farm level (Agyekum et al., 2024). Among such environments that remain under threat from the adverse impact of climate change are lowlands that are affected by the following environmental conditions – salinity intrusion, tropical cyclones, tidal flooding, and waterlogging (Ahmad, 2019; M. A. Rahman et al., 2025).
Bangladesh is well known as one of the most vulnerable countries in terms of climate change. The southern coastal region of Bangladesh presents an example of vulnerability in its extreme form. Areas such as Patuakhali and Bhola have been found to be affected by the presence of many rivers and estuaries, which makes them vulnerable to cyclones, storm surges, and increasing levels of soil and water salinity (Antu et al., 2025; Hoque et al., 2023; M. S. Rahman et al., 2023). Due to such environmental stresses, the productivity of traditional crop-growing practices is decreasing day by day, and farming families have had to change their practices in terms of what they grow (Akter et al., 2022; Begum, 2023). In such a scenario, CSA can be regarded as a method to increase agricultural productivity, build resilience against the impacts of climate change, and reduce GHG emissions (FAO, 2013; Mia & Roy, 2025; Zhao et al., 2023).
Although there is increased policy interest in CSA, the implementation of CSA by smallholder farmers has proved to be uneven and disappointing in many places. Ageing of the farming population, lack of formal education, and lack of participation in new technological developments have made it difficult for farmers to adopt new technologies that promote climate-smart agricultural development (Anuga et al., 2019; Atta-Aidoo et al., 2022). Formal education has been identified as an effective tool for enhancing agricultural technology adoption because it increases cognitive ability and the processing and use of climate information (Oli et al., 2025). Constraints in the structures of small-scale farming make it even harder for small-scale farmers to benefit from climate-smart agricultural development (Barasa et al., 2021; Naveen et al., 2024).
A closely linked set of evidence shows that there is a clear pattern of a similar adoption gradient in favor of low-cost, knowledge-based CSA methods versus capital-intensive, infrastructure-reliant technological innovations (Howlader et al., 2026a). It appears that farmers prefer gradual, relatively safe changes in the form of crop diversification, cultivation of stress-resistant crops, and grain and seed storage rather than radical innovations as a manifestation of rational risk-minimization under climate uncertainty (Zheng et al., 2024). This takes place when financial limitations and risks influence the choice of adaptation (Anugwa et al., 2022; Billah et al., 2025; J. R. Sarker et al., 2026). Consistently low rates of technology adoption, including such ones as Alternate Wetting and Drying (AWD) irrigation and solar irrigation systems, indicate that diffusion obstacles go far beyond mere lack of awareness to include limited access to credit and poor infrastructure and input/output market connections, which in turn depend on liquidity (Billah et al., 2025; Ruba et al., 2024; Ulucak et al., 2026).
The ability to access knowledge and information, through interpersonal extension, organization participation, or information and communication technology (ICT), has been found time and again to be an essential ingredient for adaptation. This is in line with the knowledge-attitude-practice model, where the acquisition of information serves as a necessary step towards behavioral change (Kifle et al., 2022), and also diffusion-of-innovation theory, where the importance of adopters and communication channels in the adoption of technological innovation in rural communities is emphasized (Colton, 2015; Rogers, 2003). Multi-channel communications have been found to promote adaptation and reduce information asymmetry within the farming community (Oyelami et al., 2022; Wang et al., 2026). However, traditional and interpersonal extension methods still prove to be more effective than digital means in settings where there is low digital literacy and ICT infrastructure (Aslam, 2025; Fabregas et al., 2019), and institutionalized participatory extension methods like Farmer Field Schools, despite research showing their effectiveness in promoting the adoption of sustainable agriculture (Ongachi et al., 2026; Waddington et al., 2012), still remain underutilized. However, the positive impacts of ICT in relation to agricultural adaptation have become questionable as more evidence becomes available that there exists what can be referred to as a “digital paradox,” where increased digital connection may not necessarily lead to enhanced climate awareness and adaptive practices, potentially reflecting factors such as misinformation, poor-quality content, or limited local relevance (Gumbi et al., 2023). The question then is how digital engagement is complementing or replacing extension in the adaptation process of farmers in coastal areas, something which is yet to be fully understood in Bangladesh.
The role of organizational participation in enhancing social capital, collective learning, and access to extension services is also well-documented, highlighting the significance of farmer organizations and institutional collective action in influencing adoption outcomes, especially in agroecological systems exposed to risks (Husen et al., 2017; Ma et al., 2023). At a broader level, these dependencies between individual characteristics, institutions, and information flow reflect the concept of Agricultural Innovation Systems (AIS), where adoption of innovations is not seen as an end in itself, but rather the outcome of interactive processes involving actors, institutions, and technologies (Gutiérrez et al., 2023; M. S. Rahman et al., 2023).
Most of the existing research on CSA adoption, on the contrary, considers those determinants separately, employing correlation or regression analysis techniques that perceive knowledge, extension communication, ICT use, organization involvement, and climate perception as equivalent predictors without seeing their connection as a chain of pathways. Such an approach may not be considered the most appropriate one, as it is unlikely that farmer decisions about adopting new technologies are affected by only one factor that operates alone; rather, adoption can be considered a consequence of several sequential processes: extension communication resulting in knowledge acquisition, knowledge formation leading to strategic behavior, and strategic behavior causing adoption. Moreover, the coastal south-central part of Bangladesh, characterized by its adaptation challenges due to high salinity levels, cyclones, and waterlogging, is rather understudied compared to other ecological zones in the country.
In this context, the current study tries to bridge three gaps in knowledge which are interlinked with each other. First of all, it transcends the traditional approach based on univariate or correlational analysis by using structural equation modeling (path analysis) to examine the hypothesized structural pathways among innovativeness, organizational participation, extension communication, ICT use, knowledge, climate perception, extension exposure, and CSA practice adoption of coastal farmers. Second, it studies the effects of ICT usage on climate change perception, providing empirical insight into the current controversy about whether ICT-based agricultural information systems increase or decrease farmers’ awareness of climate change. Finally, it draws attention to two very important and yet underexplored climate-exposed areas of coastal Bangladesh, namely Patuakhali and Bhola districts.
Thus, this study intends to (i) measure the magnitude and structure of adoption of CSA practices by coastal farmers, (ii) analyze the level of exposure of farmers to different agricultural extension approaches, and (iii) develop a structural relationship between different factors influencing farmers and their adoption of CSA practices. The goal of this study is to develop practical and evidence-based recommendations that will help develop effective hybrid strategies for agricultural extension, which will combine the conventional approach with the validated digital platform.
Conceptual Framework
The conceptual framework guiding this study is grounded in the principle that CSA adoption is not a direct behavioral outcome of individual or institutional attributes, but rather an outcome mediated by farmers’ knowledge, strategic engagement, and perceptual orientation toward climate change. As illustrated in Figure 1, the framework organizes the study variables into three conceptual tiers. The first tier comprises antecedent factors such as innovativeness, extension communication, use of ICT, and organizational participation, which represent farmers’ individual traits and their embeddedness within information and institutional networks. These antecedent factors are theoretically and empirically interrelated, as farmers with greater organizational participation tend to have broader ICT exposure and extension communication, consistent with the correlational structure reported in Table 8. The second tier consists of three mediating mechanisms: knowledge on CSA, extension strategies for promoting CSA, and climate change perception. Through these mediating mechanisms, the antecedent factors are hypothesized to exert their influence.
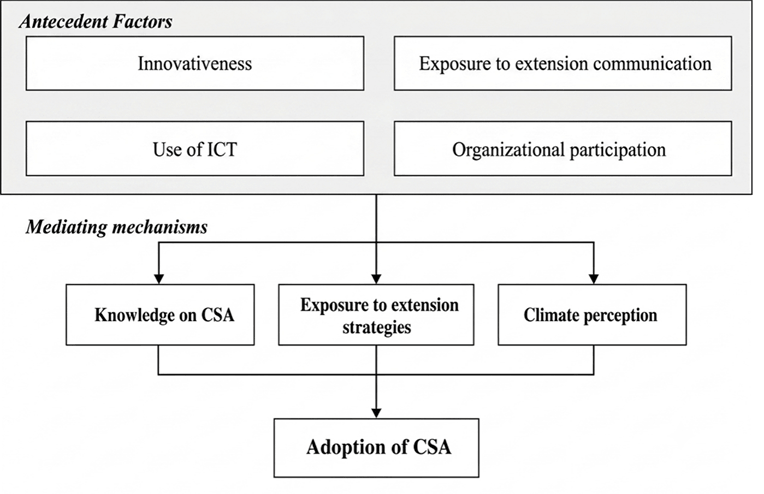
Figure 1. Conceptual framework of the study.
The mediating construct takes inspiration from the knowledge-attitude-practice (KAP) model, which proposes that acquisition of knowledge is prior to attitudinal and behavioral change (Kifle et al., 2022), and the diffusion-of-innovation theory, which states that communication media and personal innovativeness play important roles in the process of adoption of innovations (Rogers, 2003). The third level stands for the final behavioral goal of interest for CSA practices adoption, which is supposed to be driven by the three mediators, not by the antecedent variables directly, since the conceptual framework proposes that these mechanisms may transmit part of the association between antecedent factors and CSA adoption and therefore is in line with the AIS approach to innovation. Where adoption happens because of the interaction of actors, information, and institutions, but not simply individual attributes. In the proposed framework, the most influential antecedent is extension communication due to its importance for improving farmers’ knowledge and their strategic involvement in the practice of CSA; meanwhile, the use of ICT has an independent function of positively affecting strategic involvement in this framework.
2. Methodology
2.1. Study Design and Settings
This study employed a cross-sectional study design to examine farmers’ adoption behavior, knowledge, perception, and institutional exposure regarding CSA practices adoption in south-central coastal Bangladesh. The study was conducted in three coastal districts, Patuakhali, Barguna, and Bhola, which are highly vulnerable to climate change impacts such as salinity intrusion, cyclones, waterlogging, and erratic rainfall. These environmental stresses significantly influence agricultural productivity and farmers’ adaptation decisions by using CSA practices.
2.2. Population and Sampling Procedure
The study population comprised all farmers residing in the three selected districts. A multistage random sampling technique was applied to select respondents. In the first stage, one upazila such as Kalapara, Taltali, and Charfesson from Patuakhali, Barguna, and Bhola District was randomly selected respectively (Figure A2). In the second stage, one agricultural block was selected from each upazila. Thus, three agricultural blocks constituted the primary sampling units. A complete sampling frame was developed using farmer lists obtained from the respective Sub-Assistant Agriculture Officers (SAAO) of each selected block. These lists served as the official population frame for respondent selection. After completing the frame, respondents were selected randomly. The sample size was determined using the Krejcie & Morgan (1970) formula at a 95% confidence level, 5% margin of error, and 50% population proportion. Finally, this study included a total of 386 samples in the analysis.
2.3. Data Collection
Data were collected through face-to-face interviews to ensure accuracy and completeness. Verbal informed consent was obtained from the respondents. At first, a pilot test was conducted among 30 participants with the interview schedule covering three study locations to obtain valid and reliable data. For the multi-item composite variables, reliability and internal consistency were tested using Cronbach’s alpha (α) statistics following Howlader et al. (2026b), which are shown in Table 1.
Table 1. Reliability and consistency indicators for composite items of variables.
|
Sl. |
Name of variables |
Number of items |
Cronbach’s alpha (α) |
|
1 |
Extension communication |
10 |
0.700 |
|
2 |
Knowledge of CSA |
12 |
0.869 |
|
3 |
Innovativeness |
08 |
0.739 |
|
4 |
Perception of climate change |
15 |
0.670 |
|
5 |
Extension strategies for promoting CSA |
24 |
0.885 |
|
6 |
Adoption of CSA practices |
30 |
0.700 |
The scale demonstrated good internal consistency posing values around the accepted level of α-threshold (0.70; Nunnally & Bernstein, 1994), while the climate-change perception scale showed a bit lower internal consistency (α = 0.670).
Based on the responses and compatibility, necessary refinements were made before final data collection. The final questionnaire included sub-sections on socio-economic characteristics, farm attributes, extension communication, organizational participation, innovativeness, ICT usage, knowledge on CSA, perception of climate change, CSA adoption behavior, and participation in extension strategies. The instrument included multiple measurement formats such as dichotomous (Yes/No), categorical, and ordinal rating scales. CSA adoption and extension exposure were measured using Likert scales, while knowledge was assessed using a structured scoring system (correct = 2, partially correct = 1, incorrect = 0).
2.4. Measurement of Variables
2.4.1. Socio-Economic Characteristics
Socio-economic variables were measured using a combination of direct numerical reporting and categorical classification to ensure precision and analytical suitability. Age and farming experience were recorded in full years; education was measured as years of schooling; farm size was measured in hectares by aggregating owned, leased, sharecropped (Borga), and cultivated land holdings (U. K. Sarker et al., 2022). Annual household income was measured in Bangladeshi Taka (BDT) and derived from both agricultural sources (crop production, livestock, poultry, fisheries) and non-agricultural sources (business, services, and wage labor).
2.4.2. Extension Communication
Extension communication was measured using a 5-point Likert scale (0 = not even once, 1 = once, 2 = twice, 3 = three times, 4 = four or more times within the reference period) consisting of 10 items. Items included communication with Sub-Assistant Agriculture Officers (SAAO), Upazila Agriculture Officers, input dealers, model farmers, development workers, group discussions, field demonstrations, field days, agricultural fairs, and mass media platforms such as television, radio, newspapers, mobile applications, and social media. Sum of all 10 items reporting as extension communication. A higher score indicates better communication among coastal Famers. In this study, the obtained score of extension communication ranges from 1–34.
2.4.3. Organizational Participation
Organizational participation was measured by 6 items consisting of questions. This included farmers’ involvement in local institutions such as farmer groups, cooperatives, NGO-led groups, village committees, and market-related committees. Participation was categorized into levels including no participation, general membership, executive membership, and meeting attendance (regular, sometimes, or not at all).
2.4.4. Innovativeness
Innovativeness was assessed by measuring the time lag between farmers’ awareness and adoption of agricultural innovations. Respondents were categorized into non-adopters, adopters within 1 year, 2 years, 3 years, 4 years, and more than 4 years after exposure. Lower time lag indicated higher innovativeness. The total score ranged from 6–40.
2.4.5. ICT Utilization in Agriculture
ICT utilization was measured using a 6-item scale consisting of the use of digital and communication tools for agricultural information. These included mobile phone calls, mobile applications, call centers, Facebook, YouTube, and WhatsApp. Each item was rated on a four-point frequency scale: regularly (more than three times per month), sometimes (2–3 times per month), seldom (once per month), and not at all. A composite ICT usage index was computed by summing all item scores. The total score ranged from 0 to 20 in this study.
2.4.6. Knowledge of CSA
Knowledge was measured using an objective structured questionnaire covering key CSA concepts such as climate-resilient crop varieties, water-saving irrigation techniques, soil conservation, pest management, and adaptation strategies. Each response was scored as 2 for correct, 1 for partially correct, and 0 for incorrect answers. The total knowledge score was obtained by summing all item scores, where higher scores indicated greater CSA knowledge. In this study, the knowledge score ranged from 3–28.
2.4.7. Perception of Climate Change
Perception of climate change was measured using a 4-point Likert scale. This scale consists of 15 items, including temperature, rainfall pattern, salinity intrusion, cyclone frequency, pest and disease incidence, crop yield variability, biodiversity, and irrigation water availability. Responses were recorded as 3 = increased, 2 = decreased, 1 = no change, and 0 = don’t know, and the sum of the total score was included as the perception of climate change. The total score ranged between 21–45 in this study.
2.4.8. Extension Strategies for Promoting CSA
Extension strategies for promoting CSA were measured using a 24-item questionnaire with a four-point Likert scale. Responses were recorded as 3 = regular, 2 = sometimes, 1 = seldom, and 0 = not at all. Extension strategies for promoting CSA scores ranged from 3 to 56 in this study. Extension strategies for promoting CSA were ranked based on the weighted mean score. The formula used to calculate the Weighted Mean for 386(N) is:
|
|
(1) |

2.4.9. CSA Practices Adoption
Adoption of CSA practices was measured using a 30-item scale with a four-point Likert scale. Responses were recorded as 3 = regular, 2 = sometimes, 1 = seldom, and 0 = not at all, following Bhuiya et al. (2024). A higher CSA adoption practices score indicates better adoption among coastal farmers, with a total score ranging from 23–77. The adoption index was calculated using the weighted mean score. The weighted mean for each CSA practice adoption was calculated using the following formula:
|
|
(2) |

Where,
WM = Weighted Mean
fi = Frequency of the “i” th response
wi = Weight of the “i” th response (3, 2, 1, 0)
N = Total number of respondents (386)
n = Number of categories
Moreover, an effort was made to compare the relative adoption of different practices and calculate the CSA practice “adoption index” score for each of the 386 respondents (Bhuiya et al., 2024; Moonmoon, 2021). To achieve this goal, an adoption index (AI) was employed with the formula stated below (Mia & Roy, 2025).
|
|
(3) |

Where,
AI = CSA Adoption Index
WM = Weighted mean calculated by formula 1
MS = Maximum possible score (for this study it would be 3)
2.4.10. Measurement of Adoption Difficulty
The perceived implementation difficulty of each CSA practice was measured using a five-point Likert scale ranging from 1 (very easy) to 5 (very difficult). The difficulty score (DS) for each practice was calculated as the weighted mean of farmers’ responses:
|
|
(4) |

Where,
DS = Difficulty Score of a CSA practice
 = Frequency
of respondents selecting the ith difficulty category
= Frequency
of respondents selecting the ith difficulty category
 = Assigned
score of the ith difficulty category (1 = Very easy, 2 = Easy, 3 =
Moderate, 4 = Difficult, 5 = Very difficult)
= Assigned
score of the ith difficulty category (1 = Very easy, 2 = Easy, 3 =
Moderate, 4 = Difficult, 5 = Very difficult)
 = Total
number of respondents
= Total
number of respondents
2.4.11. Adoption Difficulty Matrix Analysis
The adoption–difficulty matrix is theoretically equivalent to the Importance-Performance Analysis (IPA), where two aspects of performance are considered together in order to facilitate decision-making. In the current study, adoption and the perceived implementation difficulty were adopted as the two aspects in order to categorize CSA practices based on their extension and policy priority. To assess both the adoption and perceived implementation difficulty of CSA practices at the same time, an adoption-difficulty matrix was constructed using the adoption index against difficulty scores for each practice.
2.5. Data Analysis
All descriptive statistics
(frequency, percentage, mean, and standard deviation) were determined using
SPSS 27.0.1. Path analysis was conducted using IBM SPSS AMOS (version 24) to
examine the hypothesized structural relationships among innovativeness, organizational
participation, extension communication, use of ICT, knowledge on CSA, extension strategies for promoting CSA,
perception of climate change, and CSA practice adoption. The model fit was
evaluated using standard goodness-of-fit indices, including Chi-square
statistics, Comparative Fit Index (CFI), Tucker–Lewis Index (TLI), and NFI =
Normed Fit Index; RMSEA = Root Mean Square Error of Approximation. A
significance value was set (p = <0.05). Mendeley was used to manage the
citations and references.
3. Results
3.1. Socio-Demographic Characteristics of Respondents
The socio-demographic profile of the respondents is presented in Table 2. The results indicate that nearly half of the respondents were middle-aged (36–50 years; n = 180, 46.8%), followed by older farmers aged 51–66 years (n = 103, 26.6%), and young farmers (18–34 years). Educational attainment was relatively low to moderate: 17.8% (n = 69) had no formal education, 37% (n = 143) had primary education, and about 45% (n = 175) had secondary education or above. Regarding farm size, 52.30% (n = 202) were smallholders (≤ 247 decimals), 34.70% (n = 134) were medium-scale farmers, and 13% (n = 50) operated large farms. More than half of the respondents (n = 207, 53.6%) reported no training exposure, while only 11.2% (n = 43) had long-duration training (≥ 6 days). In terms of farm location, 53.9% (n = 208) resided at a moderate distance (6–8 km) from the Upazila center, followed by 27.6% living nearby (≤ 5 km) and 18.6% in distant areas (≥ 9 km). Farming experience was relatively high, as 54.1% (n = 209) had up to 20 years of experience, while 45.9% (n = 177) had more than 20 years. Income distribution showed that 51.5% (n = 199) belonged to the low-income group, 37.5% (n = 145) to the medium-income group, and only 11.1% (n = 42) to the high-income group.
Table 2. Socio-demographic Characteristics of the participants.
|
Variables |
Frequency (n) |
Percent (%) |
|
Age (years) |
||
|
Young (18–35) |
103 |
26.70 |
|
Middle-aged (36–50) |
180 |
46.60 |
|
Older (≥ 51) |
103 |
26.70 |
|
Education |
||
|
No formal education |
69 |
17.87 |
|
Primary education |
143 |
37.05 |
|
Secondary education |
111 |
28.76 |
|
Higher secondary and above |
63 |
16.32 |
|
Farm size |
||
|
Small (≤ 247 decimals) |
202 |
52.33 |
|
Medium (248–499 decimals) |
134 |
34.72 |
|
Large (≥ 500 decimals) |
50 |
12.95 |
|
Training experience (days) |
||
|
No training (0 days) |
207 |
53.63 |
|
Short training (1–5 days) |
136 |
35.23 |
|
Long training (≥ 6 days) |
43 |
11.14 |
|
Farm distance from Upazila (km) |
||
|
Near (≤ 5 km) |
107 |
27.72 |
|
Moderate (6–8 km) |
208 |
53.88 |
|
Far (≥ 9 km) |
71 |
18.40 |
|
Farming experience (years) |
||
|
≤ 20 years |
209 |
54.15 |
|
> 20 years |
177 |
45.85 |
|
Annual income |
||
|
Low (≤ 2.0) |
199 |
51.55 |
|
Medium (2.1–4.0) |
145 |
37.57 |
|
High (> 4.0) |
42 |
10.88 |
Table 2. Cont.
|
Variables |
Frequency (n) |
Percent (%) |
|
|
Extension communication |
|||
|
Low (≤ 11) |
205 |
53.11 |
|
|
Medium (12–22) |
163 |
42.23 |
|
|
High (≥ 23) |
18 |
4.66 |
|
|
Organizational participation |
|||
|
Yes |
214 |
55.44 |
|
|
No |
172 |
44.56 |
|
|
Perception |
|||
|
Low (≤ 29) |
38 |
9.84 |
|
|
Medium (30–37) |
194 |
50.26 |
|
|
High (≥ 38) |
154 |
39.90 |
|
|
Knowledge on CSA |
|||
|
Low (≤ 12) |
137 |
35.49 |
|
|
Medium (13–20) |
227 |
58.81 |
|
|
High (≥ 21) |
22 |
5.70 |
|
|
Use of ICT |
|||
|
No (0) |
39 |
10.10 |
|
|
Low (≤ 6) |
221 |
57.26 |
|
|
Medium (7–13) |
107 |
27.72 |
|
|
High (≥ 14) |
19 |
4.92 |
|
|
Innovativeness |
|||
|
Low (≤ 17) |
45 |
11.65 |
|
|
Medium (18–29) |
144 |
37.31 |
|
|
High (≥ 30) |
197 |
51.04 |
|
3.2. Adoption of CSA Practices
The adoption pattern of CSA
practices is summarized in Table 3. Overall, adoption
levels varied substantially across practices. High adoption was observed among
several low-cost, knowledge-based practices.
Table 3. Distribution of CSA adoption among farmers (N = 386).
|
Rank |
CSA Practice |
Weighted mean |
Adoption index |
Perceived Difficulty score |
|
1 |
Raised bed homestead gardening |
2.487 |
82.90 |
2.67 |
|
2 |
Less water-required crop cultivation |
2.466 |
82.22 |
2.08 |
|
3 |
Calibrating planting time with weather |
2.464 |
82.13 |
1.42 |
|
4 |
Heat-tolerant crop |
2.322 |
77.41 |
2.33 |
|
5 |
Salinity-tolerant crop |
2.307 |
76.89 |
1.92 |
|
6 |
Short-duration crop |
2.286 |
76.2 |
1.83 |
|
7 |
Airtight pot for seed storage |
2.278 |
75.95 |
3.25 |
|
8 |
Weather forecast-based farming |
2.17 |
72.34 |
3.58 |
|
9 |
Waterlogging-resistant rice |
2.015 |
67.18 |
1.67 |
|
10 |
Foliar spray of micro-nutrient |
1.987 |
66.24 |
2.25 |
|
11 |
Crop diversity |
1.827 |
60.91 |
2.08 |
|
12 |
Rainwater harvesting/mini pond water reservoir |
1.802 |
60.05 |
3.41 |
|
13 |
Extra seed storage for disaster risk |
1.796 |
59.88 |
2.00 |
|
14 |
Integrated farming (crops-fish-poultry-cattle) |
1.794 |
59.79 |
4.00 |
|
15 |
Vermicompost /compost use |
1.657 |
55.24 |
3.00 |
|
16 |
Using eco-friendly pheromone and sticky traps |
1.608 |
53.61 |
3.08 |
|
17 |
Ridge–furrow bed preparation |
1.593 |
53.09 |
3.33 |
|
18 |
Aroid cultivation in lowland |
1.559 |
51.98 |
1.75 |
|
19 |
Using ash |
1.503 |
50.09 |
1.83 |
|
20 |
Biopesticide |
1.43 |
47.68 |
2.92 |
|
21 |
Solar irrigation |
1.418 |
47.25 |
3.83 |
|
22 |
Mulching |
1.299 |
43.3 |
1.50 |
|
23 |
Drought-tolerant crop |
1.222 |
40.72 |
2.42 |
|
24 |
Sorjan method of cultivation |
1.216 |
40.55 |
3.50 |
|
25 |
Incorporating crop residue in the field |
1.216 |
40.55 |
3.17 |
|
26 |
Sack method of cultivation |
1.101 |
36.68 |
2.17 |
|
27 |
Alternate Wetting and Drying (AWD) |
0.99 |
32.99 |
2.75 |
|
28 |
Poly-net house |
0.845 |
28.18 |
2.83 |
|
29 |
Bottle drip irrigation |
0.835 |
27.84 |
2.83 |
|
30 |
Multi-layer agriculture with Agroforestry |
0.631 |
21.05 |
3.50 |
Table 3 presents details of the adoption index and the perceived implementation difficulty of 30 CSA practices. The adoption index of the different practices was observed to vary between 21.05 and 82.90. This demonstrates the variations in terms of the level of adoption of CSA practices among the farmers of the coastal regions. On the other hand, the difficulty scores of implementations were recorded to be in the range of 1.42 to 4.00 out of 5. Higher scores indicate difficulty in implementing practices. Among the different CSA practices, the highest adoption index was found for raised-bed homestead gardening at 82.90%. Less water-consuming crop farming had an adoption index of 82.22%, while calibration of planting time with the weather had an index of 82.13%. All of these three practices had relatively low-to-moderate difficulty scores in implementing (2.67, 2.08, 1.42 respectively). This result suggests that farmers readily adopt practices that are comparatively easy to implement and provide visible benefits.
On the other hand, multi-layered farming along with agroforestry had the lowest adoption index (21.05%) with a high difficulty rating (DS = 3.50). The practices having low adoption rates along with relatively high difficulty perception include poly-net sheds (28.18%, DS = 2.83), bottle drip irrigation (27.84%, DS = 2.83), and Sorjan cultivation (40.55%, DS = 3.50). This may be because of the fact that these practices might involve higher costs, technical knowledge, or labor, which can be a hindrance to their adoption by small farmers.
3.2.1. Relationship between CSA Adoption and Perceived Difficulty
For the assessment of the relationship between adoption and perceived difficulty, a Spearman rank correlation test was conducted based on the 30 CSA practices. The negative result (ρ = −0.305, p = 0.102) can be described in a way that difficulty undermined the adoption of CSA to some extent.
3.2.2. Quadrant Analysis of Adoption and Difficulty
To gain a deeper insight into the relationship between adoption of CSA practices and perceived difficulty of implementation, the quadrant analysis was performed by taking the average adoption index (58.13%) and average difficulty index (2.72) as the cut-off points. In this way, the CSA practices are categorized into four classes depending on the degree of adoption and implementation difficulty (Figure 2). These categories include scalable practices, highly adopted but difficult to implement practices, under-utilized but easy to implement practices, and practices needing immediate attention, respectively. The quadrant analysis helps develop an efficient strategy for extending the adoption of CSA practices.
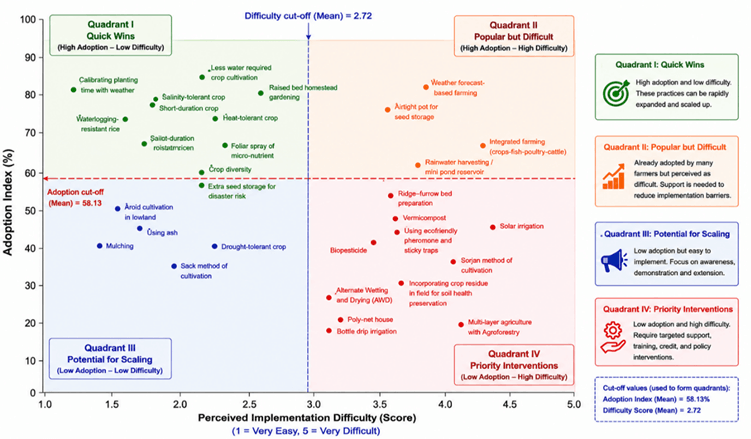
Figure 2. Two-dimensional matrix classifying CSA practices according to adoption level and perceived implementation difficulty among coastal farmers.
3.2.3. Quadrant I – Quick Wins
The practices found in this quadrant are already well established and are viewed as quite easy to implement. They are examples of CSA technologies that have been tested and can be quickly scaled up using standard agricultural extension services. Examples include climate-resilient planting periods, drought-resistant crops, and water-efficient cropping systems.
3.2.4. Quadrant II – Popular but Difficult
Despite being seen as difficult to adopt, these practices have been adopted by many people. The continuation in the adoption of these practices implies that farmers see huge benefits in adopting these practices. Some of these benefits include increased resilience, productivity, or livelihood security. Future efforts should emphasize reducing these adoption barriers.
3.2.5. Quadrant III – Potential for Scaling
These practices are relatively easy to adopt, but not sufficiently adopted as yet. The main barriers are likely to be lack of knowledge, poor extension effort, or inadequate demonstrations, and not technical problems. There is much potential here for rapid diffusion through communication and demonstration efforts.
3.2.6. Quadrant IV – Priority Interventions
The practices in this quadrant have low adoption and a high level of difficulty in implementation. This makes most of these practices costly to implement. It is important, therefore, that these technologies get priority in extension services, credit, subsidization, and other policies that can enhance their adoption by the farmers along the coast.
3.3. Extension Strategies for Promoting CSA
Table 4 presents farmers’ exposure to different extension and advisory services. The most frequently accessed intervention was miking for preparedness, with 51.8% (n = 200) reporting “always” exposure. Farmers’ home visits by extension officers were also common, with 43.0% (n = 166) indicating “sometimes” exposure. Training programs were moderately accessed, as 27.6% (n = 107) of respondents reported regular participation. Agricultural television programs were also relatively effective, reaching 24.2% (n = 93) of farmers regularly.
In contrast, institutionalized approaches such as Farmer Field Schools (FFS/FBS) were rarely accessed, with 57.2% (n = 221) reporting no exposure. Similarly, community radio services (69.1%, n = 267), motivational tours (66.8%, n = 259), mobile-based advisory services (55.2%, n = 214), and posters/leaflets (44.8%, n = 173) showed limited penetration.
Table 4. Distribution of farmers by extension strategies for promoting CSA (N = 386).
|
Rank |
Extension Strategies |
Never n |
Rarely n |
Sometimes n |
Regularly n |
WM |
|
1 |
Miking for disaster preparedness |
50 |
35 |
101 |
200 |
2.17 |
|
2 |
Training on CSA |
72 |
85 |
122 |
107 |
1.68 |
|
3 |
Agricultural TV program |
66 |
119 |
108 |
93 |
1.59 |
|
4 |
Field day |
74 |
111 |
144 |
57 |
1.48 |
|
5 |
Free fertilizer |
105 |
78 |
146 |
57 |
1.40 |
|
6 |
Encouraging farmers for high-value crop cultivation |
63 |
146 |
136 |
41 |
1.40 |
|
7 |
Demonstration |
80 |
114 |
150 |
42 |
1.40 |
|
8 |
Farmers’ home visits by extension agents |
79 |
113 |
166 |
28 |
1.37 |
|
9 |
Free seed supply |
107 |
94 |
133 |
52 |
1.34 |
|
10 |
Purchasing good-quality seed from farmers at a fair price |
123 |
74 |
134 |
55 |
1.31 |
|
11 |
Result demonstration |
115 |
102 |
130 |
39 |
1.24 |
|
12 |
Regular advisory support to commercial farmers |
102 |
148 |
83 |
53 |
1.23 |
|
13 |
Free sapling supply |
120 |
105 |
130 |
31 |
1.19 |
|
14 |
Agricultural fair |
111 |
126 |
123 |
26 |
1.17 |
|
15 |
Incentives |
140 |
82 |
139 |
25 |
1.13 |
|
16 |
Biofertilizer/Vermicompost |
157 |
80 |
107 |
42 |
1.09 |
|
17 |
Group meeting/CIG |
165 |
105 |
63 |
53 |
1.01 |
|
18 |
Prizing model farmer |
174 |
88 |
93 |
31 |
0.95 |
|
19 |
Poster/Leaflet/Booklet |
173 |
126 |
75 |
12 |
0.81 |
|
20 |
Mobile apps/Facebook |
214 |
79 |
51 |
42 |
0.80 |
|
21 |
Subsidy for mechanization |
206 |
108 |
46 |
26 |
0.72 |
|
22 |
Farmers’ field school (FFS) |
221 |
104 |
53 |
8 |
0.61 |
|
23 |
Motivational tour |
259 |
76 |
43 |
8 |
0.48 |
|
24 |
Community radio service |
267 |
64 |
48 |
7 |
0.47 |
3.4. Correlation Analysis Among Study Variables
The Spearman correlation matrix (Table 5) reveals significant interrelationships among the key constructs (Figure A1). CSA practice adoption exhibited a strong positive association with extension strategies for promoting CSA (ρ = 0.407, p < 0.01), knowledge of CSA (ρ = 0.427, p < 0.01), extension communication (ρ = 0.348, p < 0.01), innovativeness (ρ = 0.334, p < 0.01), and ICT use (ρ = 0.332, p < 0.01). Extension communication demonstrated the strongest association with extension strategies for promoting CSA (ρ = 0.687, p < 0.01), indicating its central role in shaping adaptation behavior. Knowledge of CSA was significantly correlated with extension communication (ρ = 0.439, p < 0.01) and innovativeness (ρ = 0.331, p < 0.01). Perceptions of climate change showed weak and mixed relationships, including significant negative correlations with ICT use (ρ = −0.223, p < 0.01) and extension strategies for promoting CSA (ρ = −0.111, p < 0.05), indicating a complex attitudinal structure among farmers.
Table 5. Spearman’s Rank Correlation Matrix among the study variables (N = 386).
|
Variables |
1 |
2 |
3 |
4 |
5 |
6 |
7 |
8 |
|
1. Innovativeness |
1 |
|
|
|
|
|
|
|
|
2. Extension communication |
.157** |
1 |
|
|
|
|
|
|
|
3. Organizational participation |
.060 |
.348** |
1 |
|
|
|
|
|
|
4. Use of ICT |
.106* |
.388** |
.261** |
1 |
|
|
|
|
|
5. Knowledge on CSA |
.331** |
.439** |
.260** |
.258** |
1 |
|
|
|
|
6. Perception of climate change |
.033 |
−.012 |
.067 |
−.223** |
.095 |
1 |
|
|
|
7. Extension strategies for promoting CSA |
.252** |
.687** |
.298** |
.505** |
.349** |
−.111* |
1 |
|
|
8. CSA Practice Adoption |
.334** |
.348** |
.108* |
.332** |
.427** |
.122* |
.407** |
1 |
Notes: Values are Spearman’s rank correlation coefficients (ρ).
* p < 0.05, ** p < 0.01.
3.5. Structural Model Fit
The structural equation model demonstrated an acceptable but mixed overall fit to the data (Table 6). The χ²/df ratio was 4.653, which is within the acceptable threshold (< 5.0). Several incremental fit indices were satisfactory, with CFI = 0.945, IFI = 0.947, and NFI = 0.933, all exceeding the recommended cutoff of 0.90. However, the Tucker–Lewis Index (TLI = 0.836) fell below the acceptable threshold, suggesting partial model misspecification. The RMSEA value of 0.097 exceeded the ideal limit (< 0.08), indicating moderate approximation error. Therefore, the model should be interpreted as showing generally acceptable but mixed fit, rather than uniformly good model fit.
Table 6. Model Fit Indices for the Structural Equation Model (SEM).
|
Fit Index |
Obtained Value |
Recommended Value |
|
χ² |
55.836 |
- |
|
df |
12 |
- |
|
χ²/df |
4.653 |
< 5.0 acceptable |
|
CFI |
0.945 |
≥ 0.90 |
|
TLI |
0.836 |
≥ 0.90 |
|
IFI |
0.947 |
≥ 0.90 |
|
NFI |
0.933 |
≥ 0.90 |
|
RMSEA |
0.097 |
< 0.08 |
Note: χ² = Chi-square; df = degrees of freedom; CFI = Comparative Fit Index; TLI = Tucker–Lewis Index; NFI = Normed Fit Index; IFI = Incremental Fit Index; RMSEA = Root Mean Square Error of Approximation; PCLOSE = p of Close Fit.
3.6. Structural Path Analysis
The structural relationships shown in Table 7 suggest some important paths between extension-related factors, farmer characteristics, the perception of climate change, knowledge of CSA, and adoption of CSA practices. Extension communication was the strongest predictor of extension strategies for promoting CSA (β = 0.551, CR = 14.348, p < 0.001), followed by ICT use (β = 0.276, CR = 7.204, p < 0.001) and innovativeness (β = 0.151, CR = 4.419, p < 0.001). CSA practice adoption was positively associated with extension strategies for promoting CSA (β = 0.328, CR = 7.127, p < 0.001), knowledge of CSA (β = 0.302, CR = 6.583, p < 0.001), and perception of climate change (β = 0.164, CR = 3.822, p < 0.001; Figure 3). The observed structural pathways were found to be consistent with the proposed mediating mechanism, wherein the extension-related factors and farmer characteristics were related to the knowledge and strategic behaviors, which are, in turn, related to the adoption of the CSA practice. However, since specific indirect effects were not directly estimated, these pathways represent evidence in support of the proposed pathway, rather than evidence of a statistically established mediation effect. Interestingly, ICT use exhibited a significant negative effect on perception of climate change (β = −0.200, CR = −3.773, p < 0.001), indicating a potential disconnects between digital engagement and climate awareness. The associations between them were not assessed directly in the survey and need to be further investigated. The knowledge of CSA showed a positive association with the farmers’ participation in organizations (β = 0.133, CR = 2.835, p = 0.005) and climate change perception (β = 0.119, CR = 2.242, p = 0.025), suggesting that collective participation may contribute to the knowledge and climate-related perceptions of the farmers.
Table 7. Standardized structural path estimates and covariances of the Path Model.
|
Structural Path |
B |
β |
SE |
CR |
p-value |
|
Innovativeness → Knowledge on CSA |
0.149 |
0.256 |
0.025 |
5.981 |
< 0.001 |
|
Organizational Participation → Knowledge of CSA |
0.699 |
0.133 |
0.247 |
2.835 |
0.005 |
|
Extension communication → Knowledge of CSA |
0.298 |
0.395 |
0.035 |
8.413 |
< 0.001 |
|
Innovativeness → Extension strategies for promoting CSA |
0.232 |
0.151 |
0.053 |
4.419 |
< 0.001 |
|
Extension communication → Extension strategies for promoting CSA |
1.102 |
0.551 |
0.077 |
14.348 |
< 0.001 |
|
Use of ICT → Extension strategies for promoting CSA |
0.827 |
0.276 |
0.115 |
7.204 |
< 0.001 |
|
Organizational Participation → Perception of Climate Change |
0.634 |
0.119 |
0.283 |
2.242 |
0.025 |
|
Use of ICT → Perception of Climate Change |
−0.229 |
−0.200 |
0.061 |
−3.773 |
< 0.001 |
|
Knowledge of CSA → CSA Practice Adoption |
0.647 |
0.302 |
0.098 |
6.583 |
< 0.001 |
|
Extension strategies for promoting CSA → CSA Practice Adoption |
0.264 |
0.328 |
0.037 |
7.127 |
< 0.001 |
|
Perception on Climate Change → CSA Practice Adoption |
0.346 |
0.164 |
0.090 |
3.822 |
< 0.001 |
Note: β = standardized regression coefficient; SE = standard error; CR = critical ratio; p-values are reported as two-tailed significance levels. Structural paths represent directional effects (→), while covariances between exogenous variables are indicated by (↔). All reported associations are statistically significant at p < 0.05.
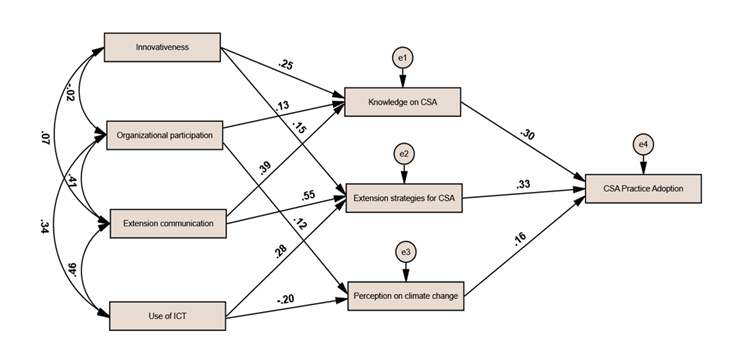
Figure 3. Path analysis model.
3.7. Correlations among Exogenous Variables
Table 8 shows significant interrelationships among exogenous variables. Extension communication was strongly associated with ICT use (CR = 8.204, p < 0.001) and organizational participation (CR = 7.407, p < 0.001). Similarly, ICT use and organizational participation were positively correlated (CR = 6.250, p < 0.001).
Table 8. Correlations among Exogenous Variables of the study.
|
Variables |
Estimate |
SE |
CR |
p-value |
|
Innovativeness ↔ Extension communication |
0.067 |
2.189 |
1.472 |
0.141 |
|
Innovativeness ↔ Organizational Participation |
−0.021 |
0.333 |
−0.448 |
0.654 |
|
Extension communication ↔ Use of ICT |
0.458 |
1.392 |
8.204 |
<0.001 |
|
Extension communication ↔ Organizational Participation |
0.406 |
0.293 |
7.407 |
<0.001 |
|
Use of ICT ↔ Organizational Participation |
0.335 |
0.191 |
6.250 |
<0.001 |
4. Discussion
This study aimed to understand the factors affecting the adoption of climate-smart agriculture (CSA) by coastal farmers, including socio-demographic factors, extension services, ICT use, organizational participation, knowledge, climate change perception, and innovativeness within the framework of structural equation modeling. The results suggest that CSA adoption is a complex phenomenon, and knowledge, innovativeness, exposure to extension, and participation in organizations of farmers are the most important factors influencing CSA adoption, and the adoption of capital-intensive CSA technologies is still limited by a lack of institutional and financial support. Moreover, the findings underscore the need to enhance agricultural extension, farmer groups, and knowledge-sharing mechanisms to facilitate the adoption of climate-smart farming practices.
This study finds that the majority of farmers in middle age group and above are involved in farming with moderate education and less exposure to formal training. This is commonly observed in smallholder agriculture where there are aging farm populations, which often limit the adoption of climate-smart innovations because of lower risk appetite and decreased adoption of new technologies (Atta-Aidoo et al., 2022; Khatri-Chhetri et al., 2017). Education is identified as a critical enabler-farmers with more education can process climate information and implement adaptive strategies. These findings align with a recent study, which also indicates that education plays a vital role in increasing the adoption of agricultural technologies by strengthening cognitive abilities and the use of information resources (Oli et al., 2025). Small farmers also dominate, making structural constraints even more pronounced. Small farm size reduces the scope for economies of scale and deters capital-intensive CSA technologies, as is well documented in the empirical adoption studies from Asia and Sub-Saharan Africa (Barasa et al., 2021; Naveen et al., 2024).
The adoption-difficulty matrix descriptively suggests that farmers are more likely to adopt CSA practices that are easier to implement, while technically demanding and resource-intensive practices remain less widely adopted (Zheng et al., 2024). The findings clearly indicate that low-cost adaptive practices and capital-intensive climate-smart technologies are different. Adoption of irrigation technologies and protected cultivation is limited, and farmers prefer to adopt practices like crop diversification, tolerant varieties, planting time adjustment, and improved storage systems. This adoption gradient is a rational risk minimization response to climate uncertainty. The same pattern has been observed among coastal farmers in Bangladesh, where limited economic resources and the risk of exposure to climate change deter them from investing in transformative adaptation measures (J. R. Sarker et al., 2026). The low adoption rates of technologies like AWD irrigation, drip systems, etc., indicate that barriers to diffusion are not only a lack of awareness but also a lack of credit access, infrastructure constraints, and poor input-output market linkages. The findings align with the empirical literature, which demonstrates that a firm’s decision to adopt CSA is heavily influenced by its liquidity and institutional support mechanisms (Billah et al., 2025; Ulucak et al., 2026).
The study emphasizes the need to strengthen and expand the use of traditional extension methods (miking, home visits, etc.) and institutionalized methods (Farmer Field Schools, mobile advisory services, etc.). This pattern may reflect a continuing “last-mile delivery gap” in agricultural extension systems, whereby information is available but not effectively disseminated to farmers through formal institutional channels. The same has been reported in research indicating the effectiveness of interpersonal extension over digital tools for areas with low digital literacy and poor ICT infrastructure (Aslam, 2025; Fabregas et al., 2019). The poor uptake of Farmer Field Schools is especially relevant since they have been demonstrated to have a significant impact on adoption of sustainable agriculture practices when applied effectively (Ongachi et al., 2026; Waddington et al., 2012).
The results of this study also find that knowledge, innovativeness, use of ICTs, and exposure to extension are the most interdependent factors associated with CSA adoption. According to the knowledge-attitude-practice model, the acquisition of knowledge is a prerequisite for attitudinal and behavioral change, and knowledge of CSA appears to represent an important intermediary pathway linking farmers’ characteristics with CSA adoption (Kifle et al., 2022). Innovativeness is also strongly associated with CSA adoption, which supports diffusion theory that early adopters facilitate technology uptake in rural systems (Colton, 2015). The strongest determinant of extension strategies for promoting CSA is extension communication, which suggests that multi-channel information dissemination is important. This is consistent with the results of other studies that have highlighted the positive effects of exposure to various communication channels on adaptive decision-making and the reduction of information asymmetry (Oyelami et al., 2022; Wang et al., 2026).
Furthermore, in the structural model, the use of ICTs was negatively related to a perception of climate change. This indicates that digital exposure does not necessarily lead to increased awareness or perception of the farmers regarding climate change. One potential explanation is that the information provided via digital channels may not be of the same quality, accuracy, or local relevance, although these mechanisms were not explicitly examined in this study. This finding could therefore be interpreted as evidence for a possible “digital paradox” that more digitization does not necessarily lead to more climate awareness or adaptive orientation (Gumbi et al., 2023; Matsvai & Hosu, 2024). The relationship between the availability of agricultural and climate information via digital platforms and the negative association needs to be understood further, which can be done by studying the type, source, quality, and utility of the information in the local context.
There is a strong link between organizational participation and knowledge and perceptions of climate, highlighting the importance of social capital in agricultural adaptation. Farmer groups enable joint learning, lower transaction costs, and improve access to extension services. This is in line with empirical evidence that social networks and collective action institutions play a key role in the adoption of agricultural innovations, especially in risk-prone environments (Husen et al., 2017; Ma et al., 2023).
Furthermore, the adoption of CSA is a result of the interplay between individual attributes, institutional structures, and information flows. The observed interrelationships among extension exposure, ICT use, and organizational participation are consistent with the possibility of mutually reinforcing information and institutional processes within an agricultural innovation system (AIS). This aligns with the Agricultural Innovation Systems (AIS) approach that views adoption as a process of dynamic interaction between actors, institutions, and technologies (Gutiérrez et al., 2023). The results also suggest that disjointed extension systems can lead to inequalities in access to climate information, further exacerbating adoption gaps.
Limitations of the Study and Future Directions
This study has demonstrated several strengths, including multistage random sampling and a structural framework for CSA adoption. The use of path analysis enabled the simultaneous examination of the hypothesized structural relationships among the study variables, including direct pathways specified in the model. There are a few limitations to be noted, too. First, specific indirect effects were not directly estimated; the degree to which mediation can be formally established is also limited. Secondly, the model is directed, yet the cross-sectional design does not allow for causal inference. Third, TLI and RMSEA were not within the standard range (e.g., TLI > 0.95, RMSEA < 0.05), indicating some model mis-specification. Lastly, sampling was limited to one upazila per district, and financial and credit-access variables, although discussed, were not formally included in the structural model, thus reducing the generalizability and explanatory range.
5. Conclusions
The current study has shown that adoption of CSA by coastal farmers in Bangladesh is a complex phenomenon, which occurs because of the cumulative effect of various factors, namely extension communication, institutional participation, knowledge of farmers, innovativeness, and climate change perception, instead of being determined by a particular factor. Farm households are willing to adopt low-cost and low-risk techniques that bring immediate results, but advanced technologies are underutilized because of existing obstacles of an institutional, financial, and infrastructure nature. The observed pathways involving extension communication, CSA knowledge, and extension exposure highlight the importance of effective dissemination and knowledge-development mechanisms, including interpersonal and community-based approaches like farmer field schools and home visits, in order to overcome the “last-mile” problem of agricultural extension. In turn, the negative relationship between ICT usage and climate change perception reveals that increased access to digital technologies is not enough for creating the climate awareness of farm households and their readiness for adaptation, and high-quality CSA related location specific content needs to be delivered as well.
The above findings point out to the need for an integrated policy framework that integrates extension services, farmer organizations’ empowerment, credit and inputs provision for high difficulty technologies, and ICT strategies to promote adoption of CSA among vulnerable coastal areas. The idea here is to move farmers from making small changes to adopting a transformational model of agriculture. Longitudinal studies are needed to confirm the directional pathways identified in this study, particularly the extension-knowledge-adoption pathway. Future research should also examine the quality and credibility of information disseminated through specific digital platforms to better understand the mechanisms underlying digital communication. Additionally, policymakers should promote the adoption of capital-intensive climate-smart technologies, such as poly-net houses and solar irrigation systems, through targeted financial support, training, and extension services.
CRediT Author Statement: Md. Sumon Howlader: Conceptualization, Methodology, Investigation, Data curation, and Writing – original draft; Md. Mamun-Ur-Rashid: Supervision, Writing – review & editing, and Validation; Md. Kamrul Hasan: Supervision, Writing – review & editing, and Validation; Md. Ektear Uddin: Conceptualization, Supervision, and Writing – review & editing.
Data Availability Statement: Data will be available on reasonable request from the corresponding author.
Funding: This study got funding for conducting the research from the Research and Training Center, Patuakhali Science and Technology University, grant number PSTU/RTC-B/01/15/24/38(08), PhD research grants, FY 2024-25.
Conflicts of Interest: The authors declare no conflicts of interest.
IRB Statement: Ethical approval was taken from institutional ethical committee of Patuakhali Science and Technology University, Dumki-8660, Patuakhali, Bangladesh. The reference number is-PSTU/IEC/26/73.
Informed Consent Statement: Informed consent was obtained from participants during data collection to be used anonymously in research and potential publication.
Acknowledgments: We thankfully acknowledge research and training center (RTC), Patuakhali Science and Technology University, Dumki-8660, Patuakhali, Bangladesh for funding this research. Special thanks go to all the farmers and extension officials who responded to our questions and help in conducting field surveys.
Abbreviations
The following abbreviations are used in this manuscript:
|
CSA |
Climate-smart Agriculture |
|
ICT |
Information and Communications Technology |
|
AIS |
Agricultural Innovation Systems |
|
FFS |
Farmer Field Schools |
|
FBS |
Farmers Business School |
|
DS |
Difficulty Score |
|
SAAO |
Sub-Assistant Agriculture Officers |
|
AI |
CSA Adoption Index |
|
WM |
Weighted Mean |
|
MS |
Maximum Possible Score |
|
RMSEA |
Root Mean Square Error of Approximation |
|
CFI |
Comparative Fit Index |
|
TLI |
Tucker–Lewis Index |
|
IFI |
Incremental Fit Index |
|
MSV |
Maximum Shared Variance |
|
χ² |
Chi-Square Statistic |
|
SE |
Standard Error |
|
Df |
Degrees of Freedom |
|
CR |
Critical Ratio |
|
β |
Standardized Regression Coefficient (Beta Coefficient) |
|
R² |
Coefficient of Determination (Explained Variance) |
Appendix A
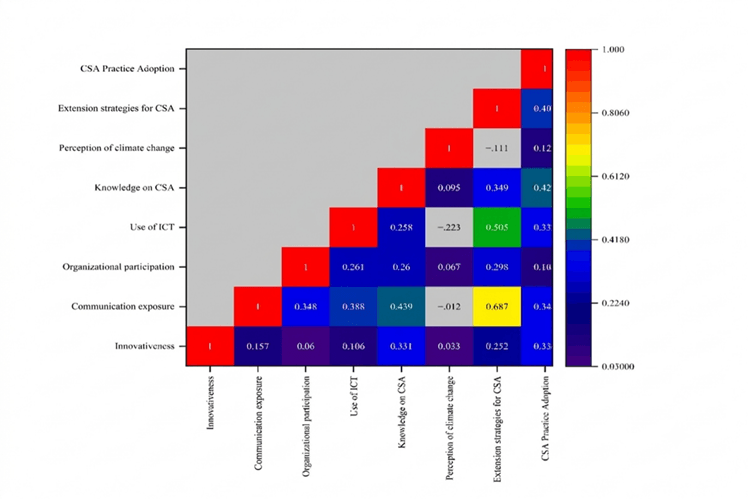
Figure A1. Correlation matrix among variables.
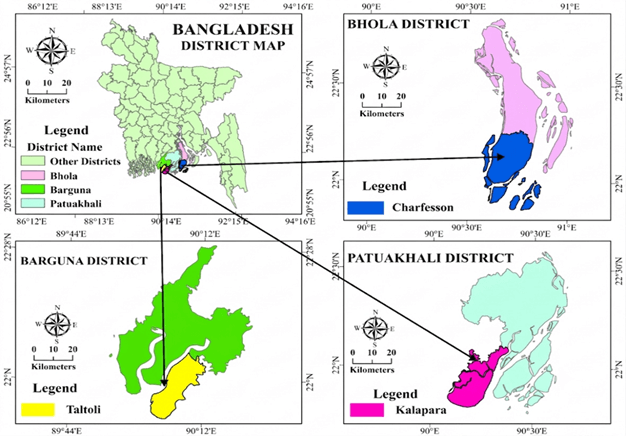
Figure A2. Map showing the study area.
References
Agyekum, T., Antwi-Agyei, P., Dougill, A., & Stringer, L. (2024). Benefits and barriers to the adoption of climate-smart agriculture practices in West Africa: A systematic review. Climate Resilience and Sustainability, 3, e279. https://doi.org/10.1002/cli2.79
Ahmad, H. (2019). Bangladesh coastal zone management status and future. Journal
of Coastal Zone Management, 22(1).
https://www.researchgate.net/profile/Hafez-Ahmad/publication/330956716
Akter, A., Geng, X., Mwalupaso, G. E., Lu, H., Hoque, F., Ndungu, M. K.,
& Abbas, Q. (2022). Income and yield effects of climate-smart
agriculture (CSA) adoption in flood prone areas of Bangladesh: Farm level
evidence. Climate Risk Management, 37, 100455. https://doi.org/10.1016/j.crm.2022.100455
Antu, P. D., Mamun-Ur-Rashid, M., Pervez, A. K. M. K., Mousumi, M. A., & Uddin, M. E. (2025). Determinants of CSA technologies adoption in coastal Bangladesh. Sarhad Journal of Agriculture, 41, 346–358. https://doi.org/10.17582/journal.sja/2025/41.4.346.358
Anuga, S. W., Gordon, C., Boon, E., & Surugu, J. M. I. (2019). Determinants of climate smart agriculture (CSA) adoption among smallholder food crop farmers in the Techiman Municipality, Ghana. Ghana Journal of Geography, 11(1), 124–139.
Anugwa, I. Q., Onwubuya, E. A., Chah, J. M., Abonyi, C. C., & Nduka,
E. K. (2022). Farmers’ preferences and willingness to pay for
climate-smart agricultural technologies on rice production in Nigeria. Climate
Policy, 22(1), 112–131. https://doi.org/10.1080/14693062.2021.1953435
Aslam, S. (2025). Digital exclusion in agricultural communication:
Exploring socioeconomic and infrastructural barriers to ICT use in rural
Pakistan. Social Sciences and Humanities Open, 12, 102264. https://doi.org/10.1016/j.ssaho.2025.102264
Atta-Aidoo, J., Antwi-Agyei, P., Dougill, A. J., Ogbanje, C. E., Akoto-Danso, E. K., & Eze, S. (2022). Adoption of climate-smart agricultural practices by smallholder farmers in rural Ghana: An application of the theory of planned behavior. PLOS Climate, 1(10), e0000082. https://doi.org/10.1371/journal.pclm.0000082
Barasa, P. M., Botai, C. M., Botai, J. O., & Mabhaudhi, T. (2021). A review of climate-smart agriculture research and applications in Africa. Agronomy, 11(6), 1255. https://doi.org/10.3390/agronomy11061255
Begum, M. E. A., Hossain, M. I., & Mainuddin, M. (2023). Climate change perceptions, determinants and impact of adaptation strategies on watermelon farmers in the saline coastal areas of Bangladesh. Letters in Spatial and Resource Sciences, 16, 19. https://doi.org/10.1007/s12076-022-00324-6
Bhuiya, R. A., Amin, M. R.,
Pervez, A. K. M. K. (2024). Adoption of resilient
climate technologies for crop production to mitigate drought in Northwestern
Bangladesh. Sarhad Journal of Agriculture, 40(3),
905–914.
https://doi.org/10.17582/journal.sja/2024/40.3.905.914
Billah, M. M., Rahman, M. M., Mahimairaja, S., Lal, A., Srinivasulu, A., & Naidu, R. (2025). Constraints and prospects of adoption of climate smart agriculture interventions: Implication for farm sustainability. Climate Smart Agriculture, 2(3), 100066. https://doi.org/10.1016/j.csag.2025.100066
Colton, J. S. (2015). Adoption, diffusion, and scaling of agricultural technologies in developing countries. In E. Lichtfouse (Ed.), Sustainable Agriculture Reviews (pp. 45–75). Springer, Cham. https://doi.org/10.1007/978-3-319-21629-4_2
Fabregas, R., Kremer, M., & Schilbach, F. (2019). Realizing the potential of digital development: The case of agricultural advice. Science, 366(6471), eaay3038. https://doi.org/10.1126/science.aay3038
Food and Agriculture Organization of the United Nations. (2013). Climate-smart agriculture source book. http://www.fao.org/docrep/018/i3325e/i3325e.pdf
Gumbi, N., Gumbi, L., & Twinomurinzi, H. (2023). Towards sustainable digital agriculture for smallholder farmers: A systematic literature review. Sustainability, 15(16), 12530. https://doi.org/10.3390/su151612530
Gutiérrez Cano, L. F., Zartha Sossa, J. W., Orozco Mendoza, G. L., Suárez Guzmán, L. M., Agudelo Tapasco, D. A., & Quintero Saavedra, J. I. (2023). Agricultural innovation system: Analysis from the subsystems of R&D, training, extension, and sustainability. Frontiers in Sustainable Food Systems, 7, 1176366. https://doi.org/10.3389/fsufs.2023.1176366
Hasan, M. K., Desiere, S., D’Haese, M., & Kumar, L. (2018). Impact of
climate-smart agriculture adoption on the food security of coastal
farmers in Bangladesh. Food Security, 10, 1073–1088. https://doi.org/10.1007/s12571-018-0824-1
Hoque, M. Z., Mahmud, A. A., Haque, M. E., Afrad, M. S. I., Hossain, M. F., Yeasmin, F., Prodhan, F. A., Rahman, M. S., Hasan, S., & Saha, S. (2023). Adoption of climate smart agricultural practices by charland farmers in Charfasson, Bangladesh. Journal of Agriculture and Ecology Research International, 24(5), 87–97. https://doi.org/10.9734/jaeri/2023/v24i5545
Howlader, M. S., Rashid, M. U., Hasan, M. K., & Uddin, M. E. (2026a). Climate-smart agriculture in fragile landscapes: A systematic review of adoption, drivers, benefits and constraints. International Journal of Agriculture and Biology, 36(1), 360111. https://doi.org/10.17957/IJAB/15.2505
Howlader, M. S., Hasan, M. K., Rashid, M. U., & Uddin, M. E. (2026b). A
gap analysis of farmers’
exposure to extension strategies for
promoting climate-smart agriculture in selected areas of coastal Bangladesh. Asian
Journal of Agriculture, 10(2), g100219.
Husen, A. N., Loos, T. K., & Siddig, K. H. A. (2017). Social capital and agricultural technology adoption among Ethiopian farmers. American Journal of Rural Development, 5(3), 65–72. https://doi.org/10.12691/ajrd-5-3-2
Khatri-Chhetri, A., Aggarwal, P. K., Joshi, P. K., & Vyas, S. (2017). Farmers’ prioritization of climate-smart agriculture (CSA) technologies. Agricultural Systems, 151, 184–191. https://doi.org/10.1016/j.agsy.2016.10.005
Kifle, T., Ayal, D. Y., & Mulugeta, M. (2022). Factors influencing
farmers adoption of climate smart agriculture to respond climate variability in
Siyadebrina Wayu District, Central highland of Ethiopia. Climate Services,
26, 100290.
https://doi.org/10.1016/j.cliser.2022.100290
Krejcie, R. V., & Morgan, D. W. (1970). Determining sample size for research activities. Educational and Psychological Measurement, 30(3), 607–610. https://doi.org/10.1177/001316447003000308
Lipper, L., Thornton, P., Campbell, B. M., Baedeker, T., Braimoh, A., Bwalya, M., Caron, P., Cattaneo, A., Garrity, D., Henry, K., Hottle, R., Jackson, L., Jarvis, A., Kossam, F., Mann, W., McCarthy, N., Meybeck, A., Neufeldt, H., Remington, T., ... Torquebiau, E. F. (2014). Climate-smart agriculture for food security. Nature Climate Change, 4, 1068–1072. https://doi.org/10.1038/nclimate2437
Ma, W., Marini, M. A., & Rahut, D. B. (2023). Farmers’ organizations and sustainable development: An introduction. Annals of Public and Cooperative Economics, 94(3), 683–700. https://doi.org/10.1111/apce.12449
Matsvai, S., & Hosu, Y. S. (2024). ICT and agricultural development in South Africa: An auto-regressive distributed lag approach. Agriculture, 14(8), 1253. https://doi.org/10.3390/agriculture14081253
Mia, M. A. T., & Roy, R. (2025). Adoption of climate–smart agriculture in the coastal area of Bangladesh. International Journal of Agricultural Research, Innovation and Technology, 15(1), 39–47. https://doi.org/10.22004/AG.ECON.359319
Moonmoon, M. (2021). Farmers’ satisfaction on the advisory services of department of agricultural extension [Doctoral dissertation, Sher-e-Bangla Agricultural University]. SAUL Archive. http://archive.saulibrary.edu.bd/xmlui/handle/123456789/3769
Naveen, N., Datta, P., Behera, B., & Rahut, D. B. (2024). Climate-smart agriculture in South Asia: Exploring practices,
determinants, and
contribution to Sustainable Development Goals. Mitigation and Adaptation
Strategies for Global Change, 29(4), 31. https://doi.org/10.1007/s11027-024-10126-4
Nunnally, J. C., & Bernstein, I. H. (1994). Psychometric theory (3rd ed.). McGraw-Hill.
Oli, D., Gyawali, B., Acharya, S., & Oshikoya, S. (2025). Factors
influencing learning attitude of farmers regarding adoption of farming
technologies in farms of Kentucky, USA. Smart Agricultural Technology, 10,
100801.
https://doi.org/10.1016/j.atech.2025.100801
Ongachi, W.,
Belinder, I., Bhat, B., Hussain, S., & Dub, R.
(2026). Strengthening agricultural extension services to enhance farmers’
capacity and resilience for sustainable development: A systematic review. BMC
Agriculture, 2(1), 17.
https://doi.org/10.1186/s44399-026-00039-9
Oyelami, L. O., Sofoluwe, N. A., & Ajeigbe, O. M. (2022). ICT and
agricultural sector performance: Empirical evidence from sub-Saharan
Africa. Future Business Journal, 8(1), 18. https://doi.org/10.1186/s43093-022-00130-y
Rahman, M. A., Swarnokar, S. C., Nayem, A. S. M., Islam, S. M., &
Gain, A. K. (2025). Farmers’ adaptation practices in climate-stressed coastal
Bangladesh: A systematic review. Environmental Research Communications, 7,
012001.
https://doi.org/10.1088/2515-7620/ada341
Rahman, M. S., Zulfiqar, F., Ullah, H., Himanshu, S. K., & Datta, A. (2023). Farmers’ perceptions, determinants of adoption, and impact on food security: Case of climate change adaptation measures in coastal Bangladesh. Climate Policy, 23(10), 1257–1270. https://doi.org/10.1080/14693062.2023.2212638
Rogers, E. M. (2003). Diffusion of innovations (5th ed.). Free Press. https://doi.org/10.4324/9780203710753-35
Ruba, U. B., Talucder, M. S. A., Zaman, M. N., Montaha, S., Tumpa, M. F. A., Duel, M. A. K., Puja, R. S., & Triza, A. H. (2024). The status of implemented climate smart agriculture practices preferred by farmers of haor area as a climate resilient approach. Heliyon, 10(4). https://doi.org/10.1016/j.heliyon.2024.e25780
Sarker, J. R., Rolfe, J., Ananda, J., & Rajapaksa, D. (2026). Farmer policy preferences for sustainable climate adaptation strategies in coastal agriculture of Bangladesh. Discover Sustainability, 7(1), 375. https://doi.org/10.1007/s43621-026-02705-z
Sarker, U. K., Kaysar, M. S., Uddin, M. R., Hossain, M.
A., Hassan, S., & Hassan, M. M. (2022). Exploring farmers’ insight on
cropping pattern for sustainable crop production in char area of Bangladesh. Sustainability,
14(3), 1745.
https://doi.org/10.3390/su14031745
Ulucak, Z. S., Sivashankar, P., Huseynov, S., & Ulucak, R. (2026).
Understanding barriers to agricultural technology adoption: Evidence from U.S.
agribusiness firms. Technological Forecasting and Social Change, 224,
124448.
https://doi.org/10.1016/j.techfore.2025.124448
Waddington, H., Snilstveit, B., Hombrados, J. G., Vojtkova, M., Anderson, J.,
& White, H. (2012). PROTOCOL: Farmer field schools for
improving farming practices and farmer outcomes in low- and middle-income
countries: A systematic review. Campbell Systematic
Reviews, 8(1). https://doi.org/10.1002/cl2.90
Wang, H., Qi, W., & Guo, W. (2026). Does ICT adoption influences
agricultural efficiency of Chinese farmers? Mechanism analysis based on
agricultural insurance and credit. Digital Economy and Sustainable
Development, 4(1), 1.
https://doi.org/10.1007/s44265-026-00076-x
Zhao, J., Liu, D., & Huang, R. (2023). A review
of climate-smart agriculture: Recent advancements, challenges, and future
directions.
Sustainability, 15(4), 3404. https://doi.org/10.3390/su15043404
Zheng, H., Ma, W., & He, Q. (2024). Climate-smart agricultural practices for enhanced farm productivity, income, resilience, and greenhouse gas mitigation: A comprehensive review. Mitigation and Adaptation Strategies for Global Change, 29(4), 28. https://doi.org/10.1007/s11027-024-10124-6