Article
Research on the Measurement of Common Prosperity in Rural Hainan Province
Qiong Yao 1,2†![]() , Yujia Zhang 1,3†, Xiaoyan Zhao 1,2, Jian Wang
1,2,5, Guomin Zhou 1,4,5,6, Li Zhang 1,*
, Yujia Zhang 1,3†, Xiaoyan Zhao 1,2, Jian Wang
1,2,5, Guomin Zhou 1,4,5,6, Li Zhang 1,*![]() , Jianhua Zhang 1,2,5,*
, Jianhua Zhang 1,2,5,*
1 Agricultural Information Institute, Chinese Academy of Agricultural Sciences, and Key Laboratory of Agricultural Big Data, Ministry of Agriculture and Rural Affairs, Beijing 100081, China; yaoqiong@caas.cn
2 National Nanfan Research Institute, Chinese Academy of Agriculture Science, Sanya 572024, China; zhaoxiaoyan01@caas.cn
3 Library and Archives (Hainan Provincial Research Center for Medical Information, University History Museum), Hainan Medical University, Haikou 571199, China; 1505302294@qq.com
4 Nanjing Institute of Agricultural Mechanization, Ministry of Agriculture and Rural Affairs, Nanjing 210014, China
5 National Agricultural Science Data Centre, Beijing 100081, China; wangjian01@caas.cn
6 Institute of Western Agriculture, Chinese Academy of Agricultural Sciences, Changji 831100, China; zhouguomin@caas.cn
* Correspondence: zhangli01@caas.cn (L.Z.); zhangjianhua@caas.cn (J.Z.)
† These authors contributed equally to this work.
|
Citation: Yao, Q., Zhang, Y., Zhao,
X., Wang, J., Zhou, G., Zhang, L., & Zhang, J. (2026). Research on the Measurement of Common Prosperity in Rural Hainan
Province. Agriculture & Rural Studies, 4(2), 16. Received: 9 March 2026 Revised: 8 May 2026 Accepted: 15 May 2026 Published: 1 June 2026
Copyright: © 2026 by the authors. Licensee SCC Press, Kowloon, Hong Kong S.A.R., China. This article is an open access article distributed under the terms and conditions of the Creative Commons Attribution (CC BY) license. |

Abstract:
Based on the superimposed background of Hainan free trade port construction and Rural Revitalization Strategy, taking the panel data of 18 cities and counties in Hainan Province from 2013 to 2024 as samples, relying on the regional characteristics of tropical islands and the policy endowment of free trade port, this paper constructs a four-dimensional evaluation index system, and uses the global principal component analysis to systematically measure the comprehensive development level of rural common prosperity. Using the spatial autocorrelation model, Theil index and other tools to analyze regional development differences and spatial agglomeration characteristics, and using spatial lag model to empirically test the spatial correlation effect of various factors. The results show that the overall level of rural common prosperity in Hainan province continues to rise, and the characteristics of regional spatial differentiation are significant. The spatial-temporal pattern of Eastern agglomeration, western slow growth, and central ecological constraints has long been formed; There is a significant positive spatial agglomeration effect in the common prosperity of cities and counties, and urbanization, human capital, agricultural technology innovation, and other factors show a significant positive correlation. This study quantitatively identifies the development weaknesses and advantages of rural common prosperity in Hainan, enriches the theoretical system of rural common prosperity in tropical island regions, provides a scientific basis for the balanced development of urban and rural areas and regional collaborative governance in the background of a free trade port, and also offers a reference for promoting common prosperity in similar tropical regions in China.Keywords:
rural common prosperity; global principal component analysis; spatial autocorrelation model; regional disparities; coordinated development1. Introduction
Achieving common prosperity remains the most arduous and crucial task in rural areas across China (J. Zheng et al., 2025). Against the strategic backdrop of rural revitalization, Chinese-style rural common prosperity is theoretically underpinned by the dual logic of high-quality development and equitable sharing, and is systematically structured along four core dimensions: prosperity level, sharing level, sustainability level, and commonness level. It emphasizes not only the expansion of rural economic scale but also the equalization of public services, regional coordinated development, and ecological sustainability (He, 2019). As the only tropical free trade port in China, Hainan Province boasts unique resource endowments, institutional advantages, and spatial characteristics (Gan et al., 2023). Promoting rural common prosperity in Hainan is not only a practical requirement for consolidating the achievements of poverty alleviation and advancing rural revitalization but also an important exploration for constructing a tropical island-style path toward common prosperity(E. Li et al., 2023; Mei et al., 2022).
Z. Chen and Yang (2023) established a linkage mechanism between income distribution and rural revitalization, arguing that narrowing the urban-rural gap is the core objective of common prosperity, requiring balanced development through rural education and social security system construction; S. Li et al. (2023) advocate prioritizing both economic growth and equitable distribution, emphasizing the pivotal role of equalizing public services in enhancing rural residents’ development capabilities. Huang (2022) and Ma et al. (2023) respectively propose dual practical pathways of technological innovation and institutional breakthroughs, focusing on digital technology empowering agricultural modernization and household registration system reforms facilitating the urbanization of agricultural migrant workers. However, existing research predominantly focuses on national macro-level analyses or case studies of typical regions (such as the Yangtze River Delta and Pearl River Delta). Specialized studies specifically addressing Hainan Province’s unique geographical environment (tropical island), economic structure (tropical agriculture + free trade port economy), and policy opportunities remain insufficient. There is a particular lack of systematic quantitative analysis concerning the spatiotemporal evolution characteristics of its rural common prosperity development level, the causes of regional disparities, and the positive association.
Despite the rich literature, notable theoretical and empirical gaps remain. First, studies on tropical island regions are extremely scarce. Hainan’s unique mountainous–coastal spatial structure, ecological constraints, tropical agricultural structure, and free trade port institutional advantages make its rural development logic fundamentally different from inland regions, resulting in the weak applicability of existing theories and conclusions. Second, existing measurement frameworks rarely integrate the four dimensions of prosperity, sharing, sustainability, and commonness within a unified spatial econometric system, leading to incomplete identification of dynamic changes and spatial disparities. Third, few studies reveal the spatial spillover mechanisms and regional heterogeneity of driving factors under the dual background of free trade port construction and ecological priority development, which weakens the policy guidance for tropical regions.
Against this background, this study aims to fill the above gaps. Based on spatial externality theory, factor flow theory, and coordinated development theory, this paper constructs a four-dimensional evaluation system of rural common prosperity. Using the panel data of 18 counties and cities in Hainan from 2013 to 2024, it employs the global principal component analysis to measure the comprehensive level. Furthermore, it uses spatial autocorrelation, Theil index, MLD, and spatial lag model (SAR) to analyze spatial-temporal evolution, regional differences, spatial agglomeration, and driving mechanisms.
The theoretical contributions of this paper are threefold. First, it expands the theoretical framework of rural common prosperity to tropical island regions, enriches the spatial theory of common prosperity under ecological constraints, and improves the applicability of relevant theories. Second, it integrates prosperity, sharing, sustainability, and commonness into a unified measurement system, which enhances the comprehensiveness and accuracy of the evaluation. Third, it identifies the spatial spillover effects and regional heterogeneity of key driving factors, which provides a new analytical perspective for understanding the formation mechanism of spatial disparities in common prosperity. Practically, this study provides empirical support and decision-making references for Hainan to promote rural common prosperity, narrow regional gaps, and coordinate high-quality development and ecological protection, and also offers experience for other tropical and island regions worldwide.
2. Materials and Methods
2.1. Data Sources
Guided by principles of data availability, continuity, and authority, panel data from 18 cities and counties (including county-level cities) in Hainan Province spanning 2013–2024 were selected as the research sample. This provides foundational data support for quantitative analysis and empirical testing in related studies. Data sources include the Hainan Statistical Yearbook (2013–2024) and the Hainan Provincial Rural Economic Statistical Annual Report. This ensures the systematic nature and comparability of indicator data, effectively safeguarding the continuity and integrity of the panel data, thereby laying a robust data foundation for the reliability and scientific validity of subsequent research conclusions.
2.2. Research Methodology
2.2.1. Global Principal Component Analysis
The global principal component analysis method is widely used in multi-dimensional comprehensive evaluation research. Its core advantage is that it can objectively determine the weight according to the correlation between indicators and avoid the deviation of subjective weight. At the same time, the time development trend and individual differences of indicators can be taken into account to ensure the comparability and accuracy of cross-time and cross-regional data (J. Chen & Lin, 2023).
At the same time, in order to eliminate the interference of extreme observation values on the measurement results, this paper uses the boxplot method to identify abnormal values, and carries out 1% horizontal bilateral tailing processing on all continuous indicators, eliminating the extreme values beyond the upper and lower 1% quantiles, so as to ensure the stable data distribution and robust results. To test whether the indicators are suitable for global principal component analysis, the KMO test and Bartlett's sphericity test are carried out in this paper. The results showed that KMO = 0.812, greater than 0.7; Bartlett's sphericity test (p < 0.001) shows that there is a strong correlation between the indicators, which is in line with the applicable premise of global principal component analysis.
Using the data after standardization and outlier processing, the comprehensive index of rural common prosperity of cities and counties in Hainan Province from 2013 to 2024 is calculated by using the global principal component analysis method.
2.2.2. Methodology for Constructing Spatial Weighting Matrices
The spatial weight matrix characterizes the degree of spatial association between regions and forms the foundation of spatial econometric analysis. Drawing upon Otto and Steinert (2023), this study constructs two types of spatial weight matrices:
Geographical Distance Spatial Weight Matrix (W₁): Measures association strength using the reciprocal square of the Euclidean distance between regional centers, with greater proximity yielding higher weights. The equation (1) is:
|
|
(1) |
Where:![]() The
influence factor for row
The
influence factor for row![]() , column
, column![]() of the spatial weight matrix
of the spatial weight matrix![]() is
represented by
is
represented by![]() .
.![]() fully
captures the spatial relationship of geographical distances between
counties/cities in terms of Chinese-style rural common prosperity development
levels;
fully
captures the spatial relationship of geographical distances between
counties/cities in terms of Chinese-style rural common prosperity development
levels;![]() denotes the
distance between region
denotes the
distance between region ![]() and region
and region ![]() .
.
Spatial adjacency weight matrix (W₂): Assigns a value of 1 if two regions share a common boundary, and 0 otherwise. The equation (2) is:
|
|
(2) |
2.2.3. Construction of the Spatial Lag Model
To examine the spatial correlation and influencing factors of rural common prosperity development levels in Hainan Province, the following spatial autoregressive (SAR) model is established (Anselin, 1998). The equation (3) is:
|
|
(3) |

Where the level of Chinese-style
rural common prosperity is denoted by CD, provincial fixed effects and time
fixed effects are represented by![]() and
and![]() respectively,
the random disturbance term is denoted by
respectively,
the random disturbance term is denoted by![]() , the
spatial lag coefficient is denoted by
, the
spatial lag coefficient is denoted by![]() , the spatial weight in the spatial spillover process of
Chinese-style rural common prosperity is denoted by W, the coefficient of the
explanatory variable is denoted by
, the spatial weight in the spatial spillover process of
Chinese-style rural common prosperity is denoted by W, the coefficient of the
explanatory variable is denoted by![]() , UL denotes urbanization
rate, HCL represents human capital, NPA indicates agricultural technology
innovation, GSA denotes agricultural production subsidies, DE denotes the
proportion of agricultural processing industries, TPE represents the level of
private sector development, and BE indicates the business environment (Including: market environment, construction of the rule of law, level
of openness, government services).
, UL denotes urbanization
rate, HCL represents human capital, NPA indicates agricultural technology
innovation, GSA denotes agricultural production subsidies, DE denotes the
proportion of agricultural processing industries, TPE represents the level of
private sector development, and BE indicates the business environment (Including: market environment, construction of the rule of law, level
of openness, government services).
2.2.4. Measurement Methodology
To comprehensively reflect regional disparities in rural common prosperity within Hainan Province, three indicators are employed: the Theil index, the geometric mean of log-deviations (GE), and the mean of log-deviations index (MLD; Lu et al., 2018; Yu et al., 2020). As these three indicators are respectively more sensitive to data fluctuations at higher, medium, and lower levels within the variable data, a combination of all three is selected to objectively reflect disparities in Hainan’s rural common prosperity.
Theil: Sensitive to variations in high-income groups. The equation (4) is:
|
|
(4) |

Where xi, n, and u denote the same meanings as in the Gini coefficient, pi represents the proportion of the population of the i-th city or county relative to the provincial total. Theil indices range between 0 and 1, with higher values indicating greater regional inequality.
GE: Sensitive to disparities within
the middle-income group, it decomposes into intra-regional variation (![]() ) and
inter-regional variation (
) and
inter-regional variation (![]() ). The equations (5) and (6) are:
). The equations (5) and (6) are:
|
|
(5) |
|
|
(6) |
where i denotes a county, t
denotes a year;![]() represents the rural common prosperity development index for county i
at time t,
represents the rural common prosperity development index for county i
at time t,![]() denotes the
mean rural common prosperity development index for the province at time t,
and N is the number of counties in the province. k denotes a
region,
denotes the
mean rural common prosperity development index for the province at time t,
and N is the number of counties in the province. k denotes a
region,![]() represents
the intra-regional variation in rural common prosperity levels at time t,
and
represents
the intra-regional variation in rural common prosperity levels at time t,
and![]() denotes the
inter-regional variation in rural common prosperity levels at time t;
denotes the
inter-regional variation in rural common prosperity levels at time t; ![]() denotes the
rural common prosperity index for county i within region k at
time t; represents the mean rural common prosperity index for region k
at time t; n denotes the number of regions;
denotes the
rural common prosperity index for county i within region k at
time t; represents the mean rural common prosperity index for region k
at time t; n denotes the number of regions;![]() denotes the
number of counties within region k.
denotes the
number of counties within region k.
MLD: Sensitive to Low-Income Group Disparities. The equation (7) is:
|
|
(7) |

where xi, n, and u denote the same meanings as in the Gini coefficient, and pi represents the proportion of the population of the i-th county/city relative to the total provincial population. The MLD index ranges between 0 and 1, with higher values indicating greater inter-regional inequality.
2.3. Variable Explanation
2.3.1. Evaluation Indicator System
Common prosperity in rural areas is not only the realistic demand to achieve common prosperity for all people, but also the only way to promote Chinese-style modernization (Ji et al., 2023; J. Sun & Zhao, 2023). Based on spatial externality theory, factor flow theory, and collaborative development theory, interregional factor flow, industrial linkage, and policy transmission determine that rural common prosperity development has a significant spatial spillover effect (N. Li et al., 2023; Zhang et al., 2023). Digital economy, social security, and other core factors are important supports for rural common prosperity, and their spatial spillover effect is the key link to promote regional collaborative development. In order to meet the practical needs of common prosperity, this paper refers to the policy guidance of “solidly promoting common prosperity” in the report of the 20th National Congress of the Communist Party of China, and combines the characteristics of tropical agriculture and free trade port in Hainan Province to build a four-dimensional evaluation index system including richness, sharing, sustainability and commonness (Q. Wang et al., 2023; Yue & Yuan, 2023). The index attributes are divided according to “positive (the higher the index value, the better the common prosperity)/negative (the higher the index value, the worse the common prosperity) ,” as shown in Table 1. Among them, digital economy and social security are the core related factors, and their spatial spillover effects on rural common prosperity are specifically manifested as follows: the digital economy is characterized by the digital inclusive financial index as the core, relying on the advantages of free trade port digital policy, breaking the geographical barriers, promoting the cross regional flow of agricultural technology, market information and financial resources, which not only helps the rapid diffusion of tropical agricultural technologies such as breeding in southern China and planting typhoon resistant crops, but also reduces the threshold of rural financing through digital Inclusive Finance. Its spillover effects can radiate to surrounding cities and counties, and drive the overall improvement of regional agricultural production efficiency and rural development quality. Social security covers indicators such as the per capita transfer income of rural residents and the urban-rural minimum living security ratio. The regional development gap is adjusted through fiscal transfer payment and public service equalization policies. The improved social security system in developed cities and counties such as Haikou and Sanya can promote the improvement of people’s livelihood security level in less developed cities and counties in the central and western regions through policy demonstration, resource sharing, experience replication and other forms, forming a positive spatial spillover of “high security areas drive low security areas,” and helping the coordinated promotion of common prosperity in rural areas throughout the region.
Table 1. Evaluation Indicator System for Rural Common Prosperity Development Levels.
|
Primary |
Secondary |
Tertiary Indicators (Unit) |
Attribute |
|
Level of Prosperity |
Education and Culture |
Per capita expenditure on education and cultural activities among rural residents (yuan) |
Positive |
|
Average Years of Education Among Rural Residents (years) |
Positive |
||
|
Ecological Environment |
Rural Greening Coverage Rate (%) |
Positive |
|
|
Social security |
Per capita transfer income for rural residents (¥10,000) |
Positive |
|
|
Ratio of urban residents receiving minimum living allowance to rural residents receiving minimum living allowance (%) |
Negative |
||
|
Healthcare |
Number of healthcare beds per thousand rural residents (units) |
Positive |
|
|
Income and Consumption |
Rural residents’ per capita disposable income (¥10,000) |
Positive |
|
|
Per capita consumption expenditure of rural residents (yuan) |
Positive |
||
|
Sharing Degree |
Educational and cultural disparity |
Average Years of Education for Urban Residents / Average Years of Education for Rural Residents (%) |
Negative |
|
Urban per capita expenditure on education and recreation / Rural per capita expenditure on education and recreation (%) |
Negative |
||
|
Income and Consumption Gap |
Urban per capita disposable income / Rural per capita disposable income (%) |
Negative |
|
|
Urban per capita consumption expenditure / Rural per capita consumption expenditure (%) |
Negative |
||
|
Healthcare Gap |
Number of healthcare beds per thousand people in urban areas / Number of healthcare beds per thousand people in rural areas (%) |
Negative |
|
|
Ecological environment disparity |
Urban green coverage rate / Rural green coverage rate (%) |
Positive |
|
|
Social security disparity |
Urban residents’ subsistence allowance rate/Rural residents' subsistence allowance rate (%) |
Negative |
|
|
Urban per capita transfer income/Rural per capita transfer income (%) |
Negative |
||
|
Sustainability |
Digitalization and Financial Development Level |
Digital Inclusive Finance Index |
Positive |
|
Rural Industrial Development |
Gross Agricultural Output Value / Total Cropped Area (¥ billion / hectares) |
Positive |
|
|
Fiscal Support for Agriculture |
Total agricultural expenditure (billion yuan) |
Positive |
|
|
Rural industrial income |
Average Wage of Employees in Agriculture, Forestry, Animal Husbandry, and Fisheries (yuan) |
Positive |
|
|
Rural ecological environment |
Carbon emissions per unit of agricultural, forestry, animal husbandry, and fishery output (tonnes per 100 million yuan) |
Negative |
|
|
Commonality |
Farmers’ income disparity |
Rural Gini coefficient |
Negative |
|
Urbanization of Farmers |
Urbanization rate (%) |
Positive |
|
|
Minimum Livelihood Guarantee for Farmers |
Rural Minimum Living Allowance (yuan/person/year) |
Positive |
|
|
Urban-rural income disparity |
Urban-Rural Income Ratio |
Negative |
2.3.2. Index Applicability Test
It can be seen from the test results (Table 2) that the KMO test value is greater than 0.7, the Bartlett’s sphericity test is significant at the 1% level, and the index commonality and cumulative variance contribution rate meet the standard requirements, indicating that there is a strong correlation between each index, which is suitable for global principal component analysis.
Table 2. Index Applicability Test Results.
|
Test Item |
Statistic |
Critical Value / Significance |
Test Item |
|
KMO Test |
0.812 |
≥ 0.7 |
Suitable for principal |
|
Bartlett Test of Sphericity |
χ² = 1468.32 |
p < 0.001 |
Significant correlation |
|
Mean Communality |
0.78 |
≥ 0.6 |
Sufficient information |
|
Cumulative Variance Contribution Rate |
78.35% |
≥ 70% |
Effective extraction |
Combined with the characteristics of Tropical Agriculture in Hainan Province, the advantages of free trade port policy and the positioning of ecological protection, the factors suitable for the measurement of rural common prosperity were screened (Kakwani et al., 2022; Zhang et al., 2023): Firstly, Urbanization Rate (UL), represented by the ratio of urban population to total regional population across Hainan’s cities and counties. Hainan’s urbanization exhibits a "high coastal, low inland" pattern, with coastal cities like Haikou and Sanya exceeding 60% urbanization, while inland ecological counties remain below 40%. Advancing urbanization is crucial for facilitating the flow of urban-rural factors and ensuring the trickle-down effects of free trade port dividends (He & Chu, 2023). Second, Human Capital (HCL), measured by the average years of schooling among rural residents in each city/county, supplemented by participation rates in South Breeding technology training. Rural residents in central Li and Miao ethnic counties exhibit lower average years of schooling, while the South Breeding industry requires technical personnel. Increased investment can enhance farmers’ employability (W. Zheng & Chen, 2023). Third, Agricultural Technology Innovation (NPA), measured by patent applications in tropical agriculture and South Breeding, including patents for typhoon-resistant crops and deep processing (T. Zhao et al., 2022). This addresses the issues of low-risk resilience and low added value in tropical agricultural products (Zhan & Li, 2022). Fourth, Agricultural Production Subsidies (GSA), represented by the proportion of tropical agriculture-specific subsidies within total fiscal expenditure on agriculture, forestry, and water affairs (Bai et al., 2022). This includes subsidies for rubber seed varieties and ecological agriculture, stabilizing farmer incomes and guiding social capital (Yang, 2023). Fifth, the proportion of agricultural processing industries (DE), measured by the output value of tropical agricultural processing relative to the total output value of agriculture, forestry, animal husbandry, and fisheries (N. Sun et al., 2024). This focuses on processing betel nuts, coconuts, and other products, absorbing rural labor, and enhancing added value (Shen et al., 2025). Sixth, private sector development level (TPE), represented by the output value of private enterprises in tropical agriculture and rural tourism as a proportion of regional GDP (Z. Zhao et al., 2024). The private sector accounts for 68% of non-agricultural employment in rural areas, broadening income sources. Seventh, the business environment (BE) is constructed across market (incremental social financing/GDP, etc.), rule of law (patent disputes/authorizations, etc.), openness (cross-border agricultural e-commerce imports/exports/GDP, etc.), and governance (proportion of expenditure on South China Sea Breeding R&D, etc.) dimensions, with the index calculated using the entropy method (L. Wang & Sun, 2025; Zhu et al., 2020).
In order to avoid multicollinearity between variables affecting the regression results, all explanatory variables were tested by the VIF test. The results show that the VIF values of each variable are between 1.25 and 2.43, with a mean value of 1.86, which is far less than the critical value of 3, indicating that there is no serious multicollinearity problem in the model.
3. Analysis of Research Findings
3.1. Temporal Evolution of Rural Common Prosperity Development Levels in Hainan Province
The comprehensive index for common prosperity in Hainan’s rural areas across all cities and counties from 2013 to 2024 was calculated using global principal component analysis, with results presented in Figure 1 and Table 3. From 2013 to 2024, Hainan’s rural common prosperity composite index rose from 0.38 to 0.61, exhibiting three distinct phases: rapid ascent (2013–2016), steady optimization (2017–2020), and quality enhancement with efficiency gains (2021–2024).
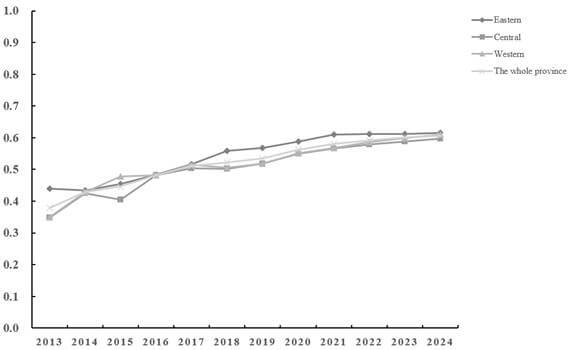
Figure 1. Development Levels of Common Prosperity in Rural Areas Across Hainan Province, 2013–2024.
Table 3. Comprehensive Index of Rural Common Prosperity Development Levels in Hainan’s 18 Municipalities and Counties (including county-level cities), 2013–2024
|
|
Region |
2013 |
2014 |
2015 |
2016 |
2017 |
2018 |
2019 |
2020 |
2021 |
2022 |
2023 |
2024 |
|
Eastern |
Haikou |
0.442 |
0.438 |
0.433 |
0.483 |
0.517 |
0.562 |
0.573 |
0.592 |
0.614 |
0.616 |
0.616 |
0.619 |
|
Sanya |
0.438 |
0.436 |
0.429 |
0.485 |
0.520 |
0.562 |
0.572 |
0.592 |
0.615 |
0.618 |
0.61 |
0.615 |
|
|
Wenchang |
0.449 |
0.430 |
0.595 |
0.480 |
0.513 |
0.559 |
0.569 |
0.587 |
0.608 |
0.608 |
0.611 |
0.612 |
|
|
Qionghai |
0.436 |
0.425 |
0.447 |
0.481 |
0.515 |
0.556 |
0.566 |
0.586 |
0.603 |
0.605 |
0.613 |
0.614 |
|
|
Wanning |
0.439 |
0.439 |
0.411 |
0.478 |
0.513 |
0.556 |
0.564 |
0.585 |
0.616 |
0.615 |
0.616 |
0.617 |
|
|
Lingshui |
0.435 |
0.432 |
0.411 |
0.491 |
0.517 |
0.557 |
0.564 |
0.586 |
0.604 |
0.605 |
0.609 |
0.612 |
|
|
Central |
Wuzhishan |
0.352 |
0.425 |
0.439 |
0.460 |
0.508 |
0.510 |
0.535 |
0.553 |
0.563 |
0.581 |
0.597 |
0.602 |
|
Dingan |
0.351 |
0.422 |
0.464 |
0.483 |
0.507 |
0.502 |
0.513 |
0.548 |
0.562 |
0.58 |
0.582 |
0.592 |
|
|
Tunchang |
0.349 |
0.420 |
0.405 |
0.480 |
0.506 |
0.501 |
0.511 |
0.545 |
0.574 |
0.578 |
0.586 |
0.597 |
|
|
Qiongzhong |
0.350 |
0.427 |
0.421 |
0.487 |
0.496 |
0.498 |
0.517 |
0.552 |
0.568 |
0.574 |
0.591 |
0.598 |
|
|
Baoting |
0.341 |
0.426 |
0.363 |
0.488 |
0.504 |
0.498 |
0.517 |
0.550 |
0.561 |
0.576 |
0.59 |
0.596 |
|
|
Baisha |
0.348 |
0.424 |
0.340 |
0.493 |
0.505 |
0.496 |
0.521 |
0.549 |
0.568 |
0.579 |
0.585 |
0.593 |
|
|
Western |
Danzhou |
0.355 |
0.422 |
0.493 |
0.485 |
0.517 |
0.514 |
0.525 |
0.549 |
0.57 |
0.609 |
0.612 |
0.619 |
|
Dongfang |
0.356 |
0.442 |
0.498 |
0.482 |
0.507 |
0.510 |
0.524 |
0.556 |
0.563 |
0.58 |
0.608 |
0.615 |
|
|
Chengmai |
0.348 |
0.440 |
0.498 |
0.478 |
0.512 |
0.511 |
0.521 |
0.566 |
0.562 |
0.581 |
0.595 |
0.609 |
|
|
Lingao |
0.346 |
0.437 |
0.453 |
0.483 |
0.520 |
0.516 |
0.523 |
0.546 |
0.569 |
0.569 |
0.579 |
0.607 |
|
|
Ledong |
0.349 |
0.430 |
0.495 |
0.477 |
0.512 |
0.490 |
0.509 |
0.545 |
0.574 |
0.567 |
0.579 |
0.605 |
|
|
Changjiang |
0.343 |
0.402 |
0.429 |
0.479 |
0.515 |
0.489 |
0.51 |
0.542 |
0.563 |
0.587 |
0.591 |
0.603 |
2013–2016: The index grew at an average annual rate of 4.8%, driven by the development of rural tourism spurred by the construction of Hainan International Tourism Island (e.g., Boao rural tourism in Qionghai, Xinglong coffee estates in Wanning), leading to an increase in the proportion of non-agricultural income for farmers.
2017–2020: The index recorded an average annual growth rate of 2.1%. This deceleration stemmed from tropical agriculture being impacted by typhoon disasters (such as Typhoon Mangkhut in 2018) and market fluctuations (e.g., declining rubber prices), while the process of equalizing public services between urban and rural areas entered a critical phase.
2021–2024: Annual average growth rate of 3.5%. Policy dividends from the Free Trade Port initiative (e.g., cross-border e-commerce boosting agricultural exports, southern seed industry enhancing farmer incomes), combined with the deepening of the rural revitalization strategy, accelerate progress towards common prosperity.
Table 3 indicates that the regional pattern of "higher in the east, lower in the center, and catching up in the west" persists, though disparities are gradually narrowing.
Eastern Region: The 2024 composite index average stands at 0.615, with Haikou (0.619), Sanya (0.618), and Wanning (0.617) ranking as the top three. Leveraging coastal tourism and tropical high-efficiency agriculture (such as coconut processing in Wenchang and cherry tomato cultivation in Lingshui), this region leads in both farmer income levels and public service quality.
Central Region: The 2024 composite index averaged 0.595, an improvement of 0.245 since 2013. Wuzhishan (0.602) and Qiongzhong (0.598) recorded the fastest growth, benefiting from ecological compensation policies (such as national park construction subsidies) and the development of distinctive industries (e.g., Baisha green tea and Qiongzhong green oranges).
Western Region: The 2024 composite index averaged 0.608, an increase of 0.252 from 2013. Danzhou (0.619) and Dongfang (0.615) ranked among the province’s top five, leveraging Yangpu Port’s logistics to boost agricultural exports (e.g., Chengmai Fucheng oranges, Lingao seafood), with notable achievements in industrial structure optimization.
3.2. Spatial Evolution Trends in Hainan Province’s Rural Common Prosperity Development Levels
From 2013 to 2024, the dynamic evolution of development disparities in rural common prosperity across Hainan Province exhibited an overall pattern of “fluctuating yet gradually stabilizing.” The consistent trends observed in the three key indicators—Theil, GE, and MLD—collectively corroborate this trajectory. As illustrated in Figure 2, all three indicators exhibited a phased upward trajectory between 2013 and 2015: the Theil index rose from 0.011 to 0.018, GE increased from 0.007 to 0.012, while the MLD rose from 0.006 to 0.011. This reflects a short-term widening of inter-regional development disparities, closely linked to the asynchronous income growth observed in certain cities and counties (such as leapfrog growth in some areas, contrasting with decelerating growth in others). From 2015 to 2020, indicators showed a sustained decline: the Theil Index fell to 0.012, while GE and MLD narrowed to 0.008 and 0.007, respectively. This indicates that policies such as the Rural Revitalization Strategy effectively promoted balanced regional development, gradually unleashing income growth momentum in low-income cities and counties and significantly narrowing disparities. From 2020 to 2021, indicators experienced a slight rebound: the Theil index rose to 0.013, while GE and MLD increased to 0.009 and 0.008, respectively. This is likely attributable to uneven short-term recovery caused by external shocks, such as the pandemic’s differential impacts on agricultural production and rural employment. From 2021 to 2024, disparities re-entered a steady narrowing trajectory. By 2024, the Theil index had decreased to 0.01, with GE and MLD stabilizing at 0.007 and 0.006, respectively—essentially reverting to 2013 levels. This demonstrates the sustained enhancement of regional development coordination under long-term policy effects. Overall, while the gap in rural common prosperity development in Hainan Province exhibited phased fluctuations over the 12-year period, a clear long-term convergence trend emerged. The consistent movement across the three indicator categories not only validates the objectivity of the gap’s evolution but also highlights the pivotal role of policy intervention in promoting regional equilibrium. This provides quantitative evidence for understanding the advancement pathways of rural common prosperity in tropical regions.
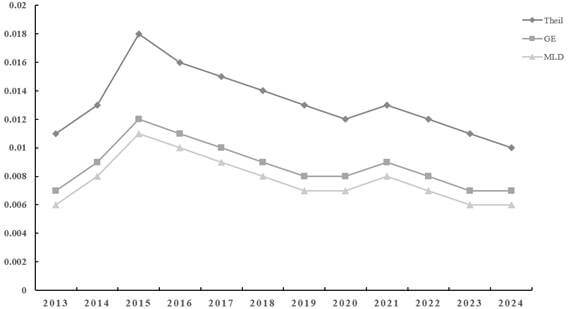
Figure 2. Trend in Development Disparities for Rural Common Prosperity in Hainan Province, 2013–2024.
3.3. Spatial Correlation Analysis of Rural Common Prosperity Development Levels in Hainan Province
To conduct an in-depth analysis of the spatial distribution characteristics of common prosperity development across cities, counties, towns, and villages in Hainan Province from 2013 to 2024, a spatial weighting matrix was constructed to characterize spatial agglomeration and dispersion patterns. The global Moran’s I index was employed to examine spatial agglomeration patterns of common prosperity from 2013 to 2024, with results presented in Table 4.
Table 4. Global Moran’s Index of Rural Common Prosperity Development Levels in Hainan Province, 2013–2024.
|
Indicator |
2013 |
2014 |
2015 |
2016 |
2017 |
2018 |
2019 |
2020 |
2021 |
2022 |
2023 |
2024 |
|
Morlan Index |
0.28 |
0.32 |
0.30 |
0.35 |
0.41 |
0.45 |
0.48 |
0.46 |
0.50 |
0.49 |
0.52 |
0.51 |
|
P-value |
0.07 |
0.05 |
0.06 |
0.04 |
0.03 |
0.02 |
0.01 |
0.02 |
0.01 |
0.01 |
0.01 |
0.01 |
|
Z-value |
1.81 |
1.98 |
1.85 |
2.09 |
2.32 |
2.51 |
2.67 |
2.59 |
2.83 |
2.79 |
2.91 |
2.87 |
The global Moran’s I index remained positive throughout the period (0.28–0.52), with P-values ≤ 0.05 and Z-values ≥ 1.98 after 2014. This indicates:
The positive correlation characteristics in spatial distribution are significant: counties and cities with high common prosperity levels (e.g., Haikou, Sanya) tend to border other high-value areas (e.g., Haikou with Wenchang, Sanya with Lingshui), while counties with lower levels (e.g., Wuzhishan, Baisha) tend to be adjacent to similarly low-performing counties (e.g., Wuzhishan with Qiongzhong, Baisha with Changjiang), forming a pattern of “high-value clustering and low-value linkage.”
The intensity of spatial agglomeration continues to increase: the Moran’s I coefficient rose from 0.28 in 2013 to 0.52 in 2023 (slightly declining to 0.51 in 2024). This indicates enhanced interregional factor flows (e.g., technology transfer from eastern to western regions, labor migration from central to eastern areas) and policy coordination (e.g., the Ring Island Tourist Highway linking eastern and western regions), with continuous strengthening of spatial connectivity between counties and cities.
3.4. Spatial Effects and Influencing Factors of Common Prosperity Development in Rural Hainan
Before spatial econometric regression analysis, in order to avoid the interference of multicollinearity between explanatory variables on the estimation results, this paper first conducts a variance inflation factor (VIF) test on each variable, and the results are shown in Table 5. The Vif values of each variable are between 1.25 and 2.43, with a mean value of 1.86, which is far below the empirical critical value of 3, indicating that there is no serious multicollinearity problem in the model, and the selection of variables and the setting of the model are reasonable, so spatial regression analysis can be further carried out.
Table 5. Model Variable Multicollinearity VIF Test Results.
|
Variable |
VIF |
1/VIF |
|
Ln UL |
2.43 |
0.41 |
|
Ln HCL |
2.17 |
0.46 |
|
Ln NPA |
1.94 |
0.52 |
|
Ln GSA |
1.82 |
0.55 |
|
Ln DE |
1.65 |
0.61 |
|
Ln TPE |
1.43 |
0.70 |
|
Ln BE |
1.25 |
0.80 |
|
Mean |
1.86 |
— |
The spatial lag model (SAR) estimation results can clearly reflect the spatial correlation characteristics of rural common prosperity in Hainan Province and the differences in the role of various variables. It can be seen from Table 6 that under the two types of spatial weight matrix settings, the spatial correlation coefficient ρ of the rural common prosperity level is significantly positive at the 1% level, indicating that there is a significant spatial positive correlation between the rural common prosperity of cities and counties in Hainan Province, and the high-level counties show the characteristics of agglomeration and distribution in space. Taking the final selected geographical adjacent spatial weight matrix (W2) as an example, the regression coefficients of urbanization rate (In UL), human capital (In HCL), agricultural technology innovation (In NPA), agricultural production subsidies (In GSA), business environment (In BE) and the level of private eco-nomic development (In TPE) are significantly positive, showing a significant positive correlation with rural common prosperity; The proportion of agricultural products processing industry (In DE) coefficient is positive but fails to pass the significance test, indicating that its positive enabling effect has not been effectively released, and its supporting effect on regional common prosperity still needs to be improved.
Table 6. Estimation Results of Spatial Lag Model (SAR) for the Development Level of Rural Common Prosperity in Hainan Province.
|
|
Time Fixed Effects |
Individual fixed effects |
Dual Fixed Effects |
|||||
|
W₁ |
W₂ |
W₁ |
W₂ |
W₁ |
W₂ |
|||
|
In UL |
0.36***(3.75) |
0.41***(4.28) |
0.38***(3.90) |
0.43***(4.42) |
0.39***(4.05) |
0.44***(4.56) |
||
|
In HCL |
0.30***(3.45) |
0.35***(3.93) |
0.32***(3.59) |
0.37***(4.06) |
0.33***(3.72) |
0.38***(4.19) |
||
|
In NPA |
0.32***(3.58) |
0.37***(4.15) |
0.34***(3.75) |
0.39***(4.28) |
0.35***(3.90) |
0.40***(4.41) |
||
|
In GSA |
0.33***(3.68) |
0.38***(4.22) |
0.35***(3.82) |
0.40***(4.35) |
0.36***(3.95) |
0.41***(4.48) |
||
|
In DE |
0.29***(3.46) |
0.34***(3.99) |
0.31***(3.60) |
0.36***(4.13) |
0.32***(3.73) |
0.37***(4.26) |
||
|
In TPE |
0.28***(3.47) |
0.33***(4.00) |
0.30***(3.61) |
0.35***(4.14) |
0.31***(3.75) |
0.36***(4.28) |
||
|
In BE |
0.31***(3.70) |
0.36***(4.23) |
0.33***(3.84) |
0.38***(4.36) |
0.34***(3.97) |
0.39***(4.50) |
||
|
ρ |
0.48***(4.02) |
0.55***(4.67) |
0.50***(4.18) |
0.57***(4.83) |
0.52***(4.35) |
0.59***(5.01) |
||
|
σ² |
0.082 |
0.076 |
0.079 |
0.071 |
0.075 |
0.068 |
||
|
R² |
0.76 |
0.81 |
0.78 |
0.83 |
0.8 |
0.85 |
||
|
LogL |
−186.3 |
−172.5 |
−180.7 |
−165.9 |
−175.2 |
−159.8 |
||
|
N |
216 |
216 |
216 |
216 |
216 |
216 |
||
Note: values in parentheses refer to z-statistics.
*** denotes significance at the 1% level.
In order to ensure the reliability of the empirical results, this paper carries out the robustness test from three aspects: (i) replace the spatial weight matrix, and use the geographical adjacent matrix and geographical distance matrix regression respectively; (ii) Lag the core explanatory variable for one period to alleviate the endogenous problem caused by potential two-way causality; (iii) Two core cities, Haikou and Sanya, were excluded for sub sample regression. The results show that the sign, size, and significance of the core variable coefficient are consistent, indicating that the benchmark regression conclusion is robust and reliable.
3.5. Spatial Disparity Analysis of Common Prosperity Development Levels in Hainan’s Rural Areas
Integrating rural development theory with quantitative data, a systematic analysis of the spatial disparity evolution in Hainan’s rural common prosperity over 12 years can be conducted by comparing the coloring characteristics of its cities and counties in 2013 and 2024, as illustrated in Figure 3 (a) and (b). The 2013 spatial map of rural common prosperity in Hainan exhibited pronounced gradient differentiation: core cities like Haikou and Sanya, along with eastern coastal counties, predominantly featured dark hues, whereas central mountainous counties such as Wuzhishan and Baisha displayed markedly lighter tones. This spatial differentiation corroborates the quantitative trend of widening rural development disparities observed between 2013 and 2015. From an economic geography perspective, eastern coastal counties leveraged their maritime locations and tourism resources to pioneer rural industrial clusters. These included Wenchang’s aerospace tourism-derived sectors and Qionghai’s Boao Forum-linked agricultural exhibitions, where high-value-added industries drove rapid income growth. Conversely, mountainous central regions, constrained by topography and infrastructure limitations, face bottlenecks in scaling up specialized agriculture and logistics cost burdens. Poor agricultural product distribution channels in autonomous counties like Qiongzhong and Baoting have resulted in sluggish income growth. This “coastal-central” development divide manifests as a distinct spatial color boundary, serving as a tangible spatial representation of initial developmental disparities.
|
|
|
|
(a) |
(b) |
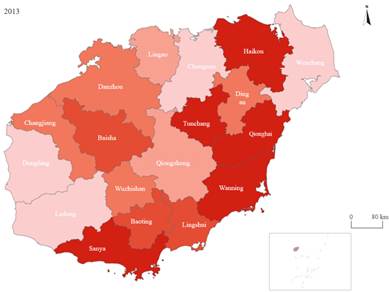
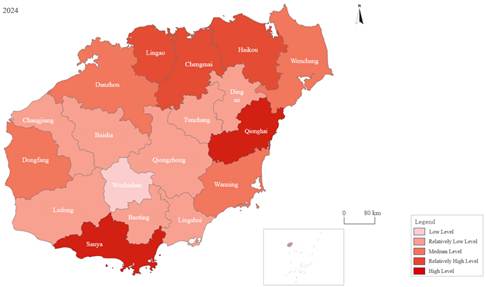
Figure 3. (a) Distribution Map of Rural Common Prosperity in Hainan Province (2013); (b) Distribution Map of Rural Common Prosperity in Hainan Province (2024).
The 2024 spatial map of rural common prosperity in Hainan Province reveals pronounced characteristics of balanced evolution: darker shades extend into central regions while lighter areas diminish, with the color gradient between coastal and central counties markedly softening – confirming the overall trend of narrowing developmental disparities. This spatial reconfiguration stems from the synergistic effects of dual mechanisms: Firstly, the balanced orientation of policy interventions has yielded substantial results. Within the framework of the rural revitalization strategy, the central ecological zone has received systematic support. Baisha Li Autonomous County has cultivated distinctive industries such as organic tea and southern medicinal herbs through the pathway of “realizing the value of ecological products.” Government-led construction of cold chain logistics systems has overcome spatial constraints on agricultural product sales. Qiongzhong Li and Miao Autonomous County established the “Wanling Cold Chain Logistics Centre,” achieving efficient production-to-market integration through a province-wide distribution network. Addressing infrastructure deficiencies has enhanced industrial competitiveness. Secondly, the spatial spillover effects of industrial synergy have become pronounced. Coastal advantage industries extending inland to form integrated value chains. The Xinglong coffee industry in Wanning, through the gradual relocation of its cultivation bases, has achieved brand and technology sharing in areas such as Qiongzhong and Tunchang. This industrial linkage breaks traditional spatial divisions, blurring the once sharply defined boundaries between urban and rural areas. It signifies a paradigm shift in rural development from “binary differentiation” to “holistic coordination.”
Observed at the micro-level of spatial analysis, the evolutionary trajectory of “gap expansion—narrowing—fluctuation—synergy” in Hainan’s rural common prosperity process is fully revealed through subtle shifts in map coloring. Coupling this spatial representation with quantitative indicators like the Theil index not only exposes the surface evolution of development disparities but also reflects the underlying logic of mechanisms such as policy guidance, industrial linkages, and risk response. Research indicates that advancing rural common prosperity necessitates establishing a synergistic framework integrating “spatial equilibrium” and “indicator optimization.” Through spatial restructuring of industrial value chains, precise allocation of policy resources, and comprehensive coverage of digital infrastructure, the spatial map of regional development can be continuously refined. This ultimately achieves a spatial evolution from “gradient differentiation” to “universal prosperity,” providing replicable spatial governance insights for rural revitalization in tropical island regions.
4. Conclusions and Recommendations
4.1. Conclusions
This paper uses the global principal component analysis method to measure the comprehensive level of rural common prosperity in Hainan Province. Combined with the spatial weight matrix and spatial econometric model, it depicts the regional spatial distribution pattern and systematically analyzes the temporal and spatial evolution characteristics of rural common prosperity and its key related factors. After empirical analysis, the core conclusions are as follows: first, the characteristics of the regional development gradient are significant. The economic development of cities and counties in Hainan Province and the level of rural common prosperity are highly coupled in the pattern of “high in the East and low in the West.” Haikou and Sanya have formed a dual nuclear polarization trend, while the development of cities and counties in the west, such as Changjiang and Dongfang, lags behind, and the urban-rural income gap is significantly greater than that in the East. The radiation conduction function of the Danzhou Qionghai development axis has not been effectively played, and the supply of public services and infrastructure construction in the western rural areas are insufficient, which is significantly different from that in the East; Second, the lack of industrial development momentum restricts the promotion of common prosperity. Problems such as the homogenization of rural tourism, the short value chain of tropical agriculture, and the disconnection between the marine economy and rural employment are prominent. The contribution rate of industrial income increase in western cities and counties to the common prosperity of rural areas is far lower than that in the East, and the level of industrial collaborative development needs to be improved; Third, the infrastructure configuration does not match the development needs of rural common prosperity, the load of Qiongbei comprehensive transportation hub is too heavy, and the density of rural water conservancy, clean energy and other infrastructure in Western China is low, which directly restricts the development of rural industry and the improvement of people’s livelihood security level, and weakens the support ability of common prosperity.
Taking 18 cities and counties in Hainan Province as the research object, this paper uses the global principal component analysis method to measure the comprehensive level of rural common prosperity. Combined with the spatial weight matrix and spatial econometric model, it systematically depicts the regional spatial distribution characteristics, deeply analyzes its spatiotemporal evolution law and key correlation factors, extracts the core conclusions combined with the empirical results, and supplements the research limitations and future research directions, so as to provide reference for the promotion of rural common prosperity in Hainan under the background of free trade port.
The empirical study shows that the development of rural common prosperity in Hainan presents distinct regional heterogeneity and phased characteristics: in regional space, the level of rural common prosperity and economic development present a highly collaborative gradient pattern of “high in the East and low in the west,” the dual nuclear polarization effect in Haikou and Sanya is prominent, the development of cities and counties in the west, such as Changjiang and Dongfang, lags behind, and there are significant gaps in urban-rural income gap, public services and infrastructure construction between the two regions, and the radiation conduction effect of the Danzhou Qionghai development axis has not been fully played. In terms of industrial support, the lack of industrial synergy has become the core constraint. Problems such as the homogenization of rural tourism, the short value chain of tropical characteristic agriculture, and the disconnection between the marine economy and rural employment have led to the fact that the contribution rate of industrial income growth in the West is far lower than that in the East, and the industrial empowerment effect has not been effectively released. At the infrastructure level, the imbalance between configuration and development demand, the coexistence of the overload of Northern Hainan transportation hub, and the insufficient supply of water conservancy and clean energy in the west, weakened the supporting foundation for rural common prosperity, and formed a development trend of “Eastern agglomeration and improvement, and western slow growth.”
There are obvious research limitations in this paper: first, the scope of the study is limited to Hainan Province, without horizontal comparison with similar tropical provinces such as Guangdong, Guangdong and Yunnan, which is difficult to highlight the policy uniqueness of Hainan free trade port; Second, the data is mainly based on the county-level panel, which is not detailed to the level of villages and towns and micro families. There are certain ecological fallacies, and the long-term time lag effect of the implementation of the free trade port policy is not fully considered. The third is to focus on the analysis of regional differences at the macro level, and the lack of discussion on the micro mechanism and farmers’ perception.
Future research can be deepened from three aspects: first, expand the scope of research, carry out cross provincial horizontal comparison, and explore the common law of rural common prosperity in similar regions and the path of differentiation in Hainan; Second, enrich data sources, integrate micro household survey data, and analyze the micro mechanism of rural common prosperity; The third is to extend the research dimension, focus on the policy time lag effect, digital technology empowerment and other directions, explore the coupling path between the realization of ecological product value and rural common prosperity, and improve the pertinence and long-term effectiveness of the research.
4.2. Recommendations
Combined with the temporal and spatial evolution characteristics of “Eastern agglomeration and upgrading, western slow growth, and central ecological constraints” of rural common prosperity in Hainan Province, this paper clearly distinguishes between empirical support type and theoretical extension type suggestions according to the short-term (1–2 years) and medium-term (3–5 years) stages, and constructs a differentiated and phased path to promote rural common prosperity, as follows:
4.2.1. Short-Term Optimization Measures
(1) Crack the weakness of Western development and narrow the regional gap. In view of the problems of lagging public services and imperfect infrastructure in western rural areas revealed by empirical research, we should focus on promoting the optimal allocation of medical resources in western rural areas, improving rural medical and health service capabilities, and gradually narrowing the gap in public services with the eastern region; Speed up the upgrading of rural transportation infrastructure in Western China, promote the hardening and quality improvement of rural trunk roads, improve road accessibility, and reduce the circulation cost of agricultural products; Make up for the weakness of rural water conservancy and clean energy infrastructure in Western China, optimize the coverage of clean energy such as photovoltaic, provide support for large-scale planting of tropical crops, and alleviate the imbalance between infrastructure and development needs.
(2) Strengthen the foundation of industrial income increase and improve the level of coordination. Based on the empirical findings of significant regional differences in the contribution rate of industrial income increase and low quality of industrial development, we should focus on the short board of the insufficient extension of the value chain of tropical characteristic agriculture, promote the development of the intensive processing industry of agricultural products, and enhance the added value of products; Build a connection platform between the marine economy and rural employment, guide rural farmers in coastal areas to participate in deep-sea aquaculture, fish processing and other related industries, and improve the supporting role of industrial income growth for rural common prosperity; We will standardize the development of rural tourism, curb homogeneous competition, enrich rural tourism formats, and increase the proportion of farmers’ tourism income.
(3) Activate regional cooperative kinetic energy and strengthen radiation drive. According to the empirical characteristics of Haikou and Sanya with obvious dual nuclear polarization and insufficient conduction effect of Danzhou Qionghai development axis, we should promote Haikou and Sanya to establish industrial cooperation mechanisms with surrounding cities, counties and villages, and promote the sinking of technology, talents and industrial resources in core cities to the countryside; Strengthen the link function of the Danzhou Qionghai development axis, promote the coordinated development of rural and core urban industries along the axis, and gradually solve the problem of unbalanced regional development.
4.2.2. Medium-Term Development Plan
(1) Build a coordinated development mechanism with characteristics and cultivate endogenous power. Taking expanding the rural interest chain of marine economy and upgrading tropical characteristic agriculture as the core, taking into account the rural livelihood security and spiritual and cultural construction, we should improve the coordinated development mechanism of cities and counties with Hainan characteristics; Relying on the advantages of the free trade port opening policy, promote the application of digital technology in rural agriculture related fields, build a traceability system for tropical agricultural products, and continue to improve the level of intensive processing of agricultural products; Establish and improve the interest linkage mechanism of “enterprises + cooperatives + farmers,” expand the coverage of coastal rural farmers’ participation in marine industry, strengthen the supporting role of science and technology for rural characteristic industries, and stimulate the endogenous driving force of rural common prosperity.
(2) Implement a differentiated regional development strategy to achieve precise empowerment. Combined with the spatial pattern of “high in the East, low in the West and ecological constraints in the middle” revealed by the empirical study, and based on the resource endowment and development orientation of cities and counties, Haikou implemented a differentiated development strategy: Haikou strengthened the guidance of airport economy and digital economy, linked the development of supporting services in surrounding villages, and driven the growth of rural residents’ non-agricultural income; Sanya will deepen the construction of an international tourism consumption center, link the southern villages to participate in the relevant links of Southern breeding and seed industry, and improve the ability of rural industry to increase income; Danzhou Yangpu Economic Circle focuses on the development of port and shipping logistics and high-end industries, improves the rural infrastructure in Western China at the same time, and cultivates rural supporting industries; Wenchang and Qionghai in the East rely on space, exhibition and other characteristic resources to cultivate new business forms such as rural research and learning, exhibition services and so on; Cities and counties in Central China strictly abide by the ecological red line, develop industries such as ecological research and branding of geographical indication products, and promote the transformation of ecological advantages into development advantages.
(3) Optimize the allocation of global elements and strengthen support. At the provincial level, the coordinated carrier of rural infrastructure and industry should be arranged in an overall way to promote the extension of urban industries to the countryside and promote the two-way flow of urban and rural factors; Set up a special fund for Rural Revitalization industry, focus on supporting the construction of characteristic industries and infrastructure in western rural areas, guide the transformation of traditional tropical crops to intensive processing, and enhance the added value of the industry; Establish the rural cooperation mechanism of “enclave economy,” promote the flow of high-quality elements such as talents and technology to the countryside, and solve the problem of factor shortage in the West; We will improve the tropical and efficient agricultural insurance system, achieve full coverage of insurance for major rural economic businesses, prevent production risks caused by natural disasters, ensure the income stability of rural residents, and provide long-term support for rural common prosperity.
CRediT Author Statement: Yao Qiong: Writing – original draft and Formal analysis; Yujia Zhang: Writing – original draft and Investigation; Xiaoyan Zhao: Formal analysis and Visualization; Jian Wang: Conceptualization, Writing – review and editing, and Funding acquisition; Guomin Zhou: Methodology, Supervision, and Project administration; Li Zhang: Methodology; Jianhua Zhang: Conceptualization, Writing – review and editing, and Funding acquisition.
Data Availability Statement: Not applicable.
Funding: This research was funded by the National Key Research and Development Program of China (Grant Nos. 2022YFF0711800 and 2023YFD1600300); the Nanfan Special Project, CAAS (Grant Nos. YBXM2430, YBXM2409, YBXM2410, YBXM2508, and YBXM2509); Natural Science Foundation of Hainan Province (Grant No. 325MS155); the Special Fund of Chinese Central Government for Basic Scientific Research Operations in Commonweal Research Institutes (Grant Nos. Y2025YC90, Y2025ZZ01, Y2026YC40, JBYW-AII-2025-05, and JBYW-AII-2026-22); the National Agricultural Science Data Centre (Grant No. NASDC2026XM11); 2025 Joint Project for Industrial Science and Technology Innovation “Unveiling and Commanding” of Sanya Yazhou Bay Science and Technology City Administration and Hainan Seed Industry Laboratory (Grant No. B25Y1Q010).
Conflicts of Interest: The authors declare no conflicts of interest.
IRB Statement: Not applicable.
Informed Consent Statement: Not applicable.
Acknowledgments: The authors would like to thank the anonymous reviewers and editors for their valuable suggestions and comments, which helped to improve this manuscript.
Abbreviations
The following abbreviations are used in this manuscript:
|
SAR |
Spatial Lag Model (Spatial Autoregressive Model) |
|
GDP |
Gross Domestic Product |
|
VIF |
Variance Inflation Factor |
|
FTP |
Free Trade Port |
|
UL |
Urbanization Rate |
|
HCL |
Human Capital |
|
NPA |
Agricultural Technology Innovation |
|
GSA |
Agricultural Production Subsidies |
|
DE |
Agricultural Products Processing Industry Proportion |
|
TPE |
Private Economic Development Level |
|
BE |
Business Environment |
|
MLD |
Mean Logarithmic Deviation |
|
GE |
Generalized Entropy Index |
|
KMO |
Kaiser–Meyer–Olkin Test |
|
PCA |
Principal Component Analysis |
|
GPCA |
Global Principal Component Analysis |
References
Anselin, L.
(1988). Spatial econometrics: Methods and models. Springer
Dordrecht.
https://doi.org/10.1007/978-94-015-7799-1
Bai, J., Zhang, Y., & Bian, Y. (2022).
Does innovation-driven policy increase entrepreneurial activity in
cities—evidence from the national
innovative city pilot policy. China Industrial Economy, 6, 61–78.
Chen, J., & Lin, Z. (2023). Measurement and driving factors analysis of the high-quality development levels of China’s agricultural circular economy. Inquiry into Economic Issues, (10), 85–97.
Chen, Z., & Yang, X.
(2023).
On the measurement indicators
of common prosperity and the phased progress in
China. Economic Research
Journal, 58(9), 79–97.
Gan, T., Zhang, M., & Zhang, Z. (2023). The impact of digital government policy on entrepreneurial activity in China. Economic Analysis and Policy, 79, 479–496. https://doi.org/10.1016/J.EAP.2023.06.029
He, X. (2019). Digital
entrepreneurship solution to rural poverty:
Theory, practice and policy implications. Journal of Developmental
Entrepreneurship, 24(1), 1950004. https://doi.org/10.1142/S1084946719500043
He, X., & Chu, D. (2023). The digital transformation of government governance and the increase in urban entrepreneurial activity. Shanghai Journal of Economics, 9, 41–53.
Huang, J. K. (2022). Comprehensively implementing the Rural Revitalization Strategy needs to promote rural construction steadily. Newsletter About Work in Rural Areas, (5), 36–38. https://doi.org/10.3969/j.issn.0546-9503.2022.05.015
Ji, M., Jiao, Y., & Cheng, N. (2023). An Innovative
decision-making scheme for the high-quality economy development driven by
higher
education. Journal of Innovation & Knowledge,
8(2), 100345. https://doi.org/10.1016/j.jik.2023.100345
Kakwani, N., Wang, X., Xue, N., & Zhan, P. (2022). Growth and common prosperity in China. China
& World Economy, 30(1), 28–57.
https://doi.org/10.1111/cwe.12401
Li, E., Chen, Q., Zhang, X., & Zhang, C. (2023). Digital government development, local governments’ attention distribution and enterprise total factor productivity: Evidence from China. Sustainability, 15(3), 2472. https://doi.org/10.3390/SU15032472
Li, N., Zhang, G., & Zhang, N. (2023). Comprehensive evaluation of urban resilience levels and analysis of regional heterogeneity in China. Statistics & Decision, 39(19), 117–120. https://link.cnki.net/doi/10.13546/j.cnki.tjyjc.2023.19.021
Li, S., Shi, X., Tao, Y., & Shu, Y. (2023). Promoting common prosperity by focusing on income growth for rural low-income populations: Key areas, challenges and policy recommendations. Issues in Agricultural Economy, (2), 4–19. https://link.cnki.net/doi/10.13246/j.cnki.iae.2023.02.005
Lu, X., Kuang, B., & Li, J. (2018). Regional difference decomposition and policy implications of China’s urban land use efficiency under the environmental restriction. Habitat International, 77, 32–39. https://doi.org/10.1016/j.habitatint.2017.11.016
Ma, S., He, G., & Guo, J. (2022). The welfare effect of digital agriculture: Deconstruction from the perspective of value recreation and value redistribution. Issues in Agricultural Economy, (5),10–26. https://doi.org/10.13246/j.cnki.iae.2022.05.006
Mei, Y., Miao, J., & Lu, Y. (2022). Digital villages construction accelerates
high-quality economic development in rural China through
promoting digital entrepreneurship.
Sustainability, 14(21), 14224. https://doi.org/10.3390/SU142114224
Otto, P., & Steinert, R. (2023). Estimation of
the spatial weighting matrix for spatiotemporal
data under the presence of
structural breaks.
Journal of Computational and Graphical Statistics, 32(2), 696–711.
https://doi.org/10.1080/10618600.2022.2107530
Shen, C., Wu, X., Shi, L., Wan, Y., Hao, Z., Ding, J., & Wen, Q. (2025). How does the digital economy affect the
urban–rural income gap?
Evidence from Chinese cities. Habitat International,
157, 103327. https://doi.org/10.1016/j.habitatint.2025.103327
Sun, J., & Zhao, W. (2023). How does digital financial literacy promote the common prosperity of farmers and rural areas? Journal of Shanghai University of Finance and Economics, 25(3), 33–46. https://link.cnki.net/doi/10.16538/j.cnki.jsufe.2023.03.003
Sun, N., Yang, S., & Chen, W. (2024). The activity and external driving factors of digital entrepreneurship in Chinese cities. China Business and Market, 38(3), 23–32. https://link.cnki.net/doi/10.14089/j.cnki.cn11-3664/f.2024.03.003
Wang, L., & Sun, Y. (2025). Digital dividends? Rural E-commerce policy and urban-rural income
disparity in China. Telecommunications
Policy, 49(10), 103058. https://doi.org/10.1016/j.telpol.2025.103058
Wang, Q., Li, J., & Liu, Y. (2023). Influence of rural industry integration on common affluence of counties. Statistics & Decision, 39(19), 28–33. https://link.cnki.net/doi/10.13546/j.cnki.tjyjc.2023.19.005
Yang, Q. (2023). Research
on the impact of digital government construction
on rural entrepreneurial vitality in the context
of Chinese
modernization. Lanzhou Academic Journal, (12), 134–145. https://link.cnki.net/urlid/62.1015.C.20231123.1654.004
Yue, M., & Yuan, H. (2023). Digital economic development, institutional environment and common prosperity. Modern Economic Research, (11), 17–27. https://link.cnki.net/doi/10.13891/j.cnki.mer.2023.11.005
Yu, Z., Li, X., Mu, F., Meng, Q., Wu, S., & He, L. (2020). Comparison of different formulas for calculating Theil Indices. Chinese Journal of Health Statistics, 37(1), 124–126.
Zhan, Y., & Li, S. (2022). Smart city construction, entrepreneurial vitality and high-quality economic development: Analysis based on the GTFP perspective. Journal of Finance and Economics, 48(1), 4–18. https://doi.org/10.16538/j.cnki.jfe.20211015.101
Zhao, T., Zhang, Z., & Liang, S. (2022). Digital economy, entrepreneurship, and high-quality economic
development: Empirical evidence from urban China. Frontiers of Economics in
China, 17(3), 393–426.
https://journal.hep.com.cn/fec/EN/10.3868/s060-015-022-0015-6
Zhao, Z., Liu, R., & Wang, Q. (2024). Place-based
polices and e-commerce development in rural China. China Economic Review,
83, 102085.
https://doi.org/10.1016/j.chieco.2023.102085
Zhang, L., Deng, Z., Zhang, C., &
Liu, P. (2023). China’s common prosperity: Logic, profile
and regional difference. Chinese Journal of
Population Science, 37(5), 113–128.
Zheng, J., Zhang, X., & Wang, J. (2025).
The role
of digital governance in fostering county-level digital entrepreneurial
vitality: A quasi-experimental analysis
of China’s information accessibility pilot. Sustainability, 17(20), 9096.
https://doi.org/10.3390/su17209096
Zheng, W., & Chen, H. (2023). The impact of market-based allocation of data elements on urban economic resilience: Promotion or inhibition? A quasi-natural experiment based on data trading platform. Modern Finance and Economics-Journal of Tianjin University of Finance and Economics, 43(12), 78–92.
Zhu, Z., Ma, W., & Leng, C. (2020). ICT adoption, individual income and psychological health of rural households in China. Applied Research in Quality of Life, 17, 71–91. https://doi.org/10.1007/s11482-020-09879-2