Article
The Welfare Level of Rice Farmers in the Bengawan Solo Watershed, Indonesia
Nur Rahmawati 1,*![]() , Chelsea Anindita 1
, Chelsea Anindita 1![]() ,
Zuhud Rozaki 1
,
Zuhud Rozaki 1![]() and Triyono 1
and Triyono 1![]()
1 Department of Agribusiness,
Universitas Muhammadiyah Yogyakarta, Yogyakarta 55183, Indonesia;
c.anindita.fp23@mail.umy.ac.id (C.A.); zaki@umy.ac.id (Z.R.); triyono@umy.ac.id (T.)
* Correspondence: rahma_wati_mf@umy.ac.id
|
Citation: Rahmawati, N., Anindita, C., Rozaki, Z., & Triyono. (2026). The Welfare Level of Rice Farmers in the Bengawan Solo Watershed, Indonesia. Agricultural & Rural Studies, 4(1), 17. https://doi.org/10.59978/ar04010001 Received: 5 November 2025 Revised: 23 December 2025 Accepted: 30 December 2025 Published: 9 February 2026
Copyright: © 2026 by the authors. Licensee SCC Press, Kowloon, Hong Kong S.A.R., China. This article is an open access article distributed under the terms and conditions of the Creative Commons Attribution (CC BY) license. |

Abstract
The welfare of rice farmers in the Bengawan Solo Watershed region is a critical issue, as it reflects the socioeconomic conditions of agrarian communities that depend on the sustainability of natural resources and agricultural productivity. The objective of this research is to analyze how rice farming contributes to household income and overall welfare. This study aims to determine the level of household welfare of rice farmers in the Bengawan Solo Watershed area, Central Java. Sampling was conducted using an unproportional random sampling method on 240 farmers in six districts in Central Java. Data analysis used the Good Service Ratio (GSR), Farmer Household Income Exchange Rate (FHIER), and Farmer Exchange Rate (FER) indicators. The results showed that a GSR value of 0.38 indicates a higher allocation of household expenditure toward non-food needs. Furthermore, an FHIER value of 1.40 indicates that total household income exceeds total household expenditure. However, a FER value of 99.21 indicates that income derived solely from rice farming is insufficient to cover all household expenses. These findings suggest that although rice farming plays an important role in household income, farmer welfare in the Bengawan Solo Watershed remains highly dependent on income diversification and continued productivity improvement, and institutional support.Keywords
FER; FHIER; GSR; farmer welfare; watershed rice farmers1. Introduction
Rice (Oryza Sativa) is a major agricultural commodity and serves as a staple food for a large proportion of the global population, particularly in Asia, with Indonesia being one of the primary consumers (Istiyanti et al., 2025). With a population of more than 270 million people, Indonesia is heavily dependent on rice production to meet its staple food needs. Data from the Pusat Data dan Sistem Informasi Pertanian (2022), rice consumption on a household scale as a staple food reaches 81,044 kg/cap per year. Given this high demand, rice farming in Indonesia continues to expand each year (Rifin et al., 2024). However, rice cultivation is highly water-dependent, as irrigation plays a critical role in sustaining production. Water sources are derived from both groundwater and river systems (Prikhodko & Bandurin, 2023).
As an agricultural country, Indonesia has many agricultural systems, one of which is the watershed rice farming system (Ramadhani et al., 2021). Cultivating rice in watersheds offers several advantages, including enhanced agricultural productivity and more efficient utilization of water resources (Liu et al., 2021). The watershed has good morphometric and hydrological characteristics, so it can ensure sufficient water supply for rice growth (Yanti et al., 2021).
With an abundance of water, areas crossed by rivers can be ideal land for growing rice (List et al., 2020; Punnoli et al., 2025). However, farmers in watershed regions remain highly vulnerable to frequent and unpredictable flooding events, exacerbated by climate change (Punnoli et al., 2025). Such floods reduce productivity and result in substantial economic losses, directly affecting farmers’ livelihoods by damaging crops, lowering yields, and diminishing household income.
In Indonesia, particularly within the Bengawan Solo Watershed, seasonal flooding remains a recurring and increasingly complex issue, as the agricultural sector, especially food crop production, faces major challenges arising from the impacts of climate change (Susanawati et al., 2022). River overflows during the rainy season, exacerbated by land degradation caused by erosion, sedimentation, and declining soil fertility, have direct adverse impacts on the condition and quality of agricultural land (Soemitro et al., 2021). In addition, suboptimal water resource management in the Bengawan Solo Watershed has led to imbalances in water availability between the rainy and dry seasons (Rosalia et al., 2021). This combination of factors reduces agricultural productivity by delaying rice planting schedules, increasing the risk of crop failure, and decreasing crop yields, which ultimately affects farmers’ income levels and the welfare of farming households in the Bengawan Solo Watershed (Priyana et al., 2024).
Beyond production losses, these recurring environmental stresses have significant economic implications for farming households. Reduced yields, higher input costs, and increased production uncertainty collectively contribute to low farm profitability and a declining Farmer Exchange Rate (FER), indicating that farmers’ purchasing power fails to keep pace with rising production costs. In flood-prone areas such as the Bengawan Solo Watershed, these pressures intensify household economic vulnerability and limit farmers’ capacity to reinvest in agricultural activities or adopt adaptive technologies. While at the national level, the Farmer Exchange Rate (FER) reached 114.14 in 2023, as reported by Statistics Indonesia (BPS); this figure represents an aggregate condition and does not fully capture local disparities. In flood-prone regions like the Bengawan Solo Watershed, the FER is likely to be considerably lower due to persistent environmental shocks (Slamet Widodo et al., 2024).
Despite the growing body of literature on flooding, land degradation, and rice production in the Bengawan Solo Watershed, systematic assessments of farmer welfare that integrate economic performance indicators remain limited. Existing studies predominantly focus on biophysical impacts or short-term income fluctuations, while comparative regional analyses that examine variations in farmer welfare across flood-affected areas are scarce. Moreover, the role of low FER and limited farm profitability as key determinants of farmer welfare has not been comprehensively examined within the context of the Bengawan Solo Watershed. This gap underscores the need for a more integrated and regionally comparative approach to understanding farmer welfare in environmentally vulnerable rice-producing regions.
Farmer welfare is an important indicator because it is closely related to their income level, which determines farmers’ ability to meet their living needs and invest in farming (Aleksandrova et al., 2024). Welfare levels are commonly assessed through indicators such as household income, land ownership, farming experience, education level, and production capacity (Ojo et al., 2020). The level of welfare reflects the extent to which farming families are able to meet their living needs.
Various previous studies have addressed the welfare of rice farmers in the Bengawan Solo Watershed, with varying focuses and approaches. This study, therefore, seeks to provide a more comprehensive analysis of farmer welfare, with the aim of providing insight and describing the level of farmer welfare.
2. Materials and Methods
2.1. Location and Time of Research
This study adopts a quantitative descriptive approach to assess the welfare levels of rice farmers in the Bengawan Solo Watershed, Central Java. The focus of the study covers six regencies in Central Java: Wonogiri, Sragen, Karanganyar, Sukoharjo, Klaten, and Boyolali. The research locations were determined purposively, taking into account regional accessibility, the presence of farmer institutions or groups, the availability of natural resources, and the number of farming households. The study was conducted over a three-month period, from June to August 2025, encompassing preparation and coordination, field data collection, and preliminary analysis. Research activities were adjusted to field conditions, with the June–August timeframe serving as the primary reference for implementation.
2.2. Sampling Procedure and Data Collection
This study employed a survey method using direct interviews with respondents through a structured questionnaire. The sampling technique used was disproportionate random sampling, in which the study area and respondents were selected through multiple stages. First, six regencies in Central Java Province located within the Bengawan Solo Watershed were selected based on specific research considerations, namely their status as major rice production centers and their regular exposure to seasonal flooding. Subsequently, within each selected regency, rice farmers were chosen using simple random sampling.
An equal number of 40 rice farmers was randomly selected from each regency, resulting in a total sample size of 240 respondents (Table 1). The determination of an equal sample size across regencies was intended to ensure balanced representation among study areas, rather than reflecting the actual population proportion in each regency. The selection of farmer respondents was based on the following criteria: (1) active farmers who were currently cultivating or had cultivated rice within the past year, (2) farmers residing within the Bengawan Solo Watershed, and (3) farmers with at least one year of farming experience. Farmers who were not actively engaged in rice farming activities during the study period were excluded from the sample.
Table 1. Sampling Procedure and Data Collection.
|
Research Location |
Number of Respondents |
|
Wonogiri |
40 |
|
Sragen |
40 |
|
Karanganyar |
40 |
|
Sukoharjo |
40 |
|
Klaten |
40 |
|
Boyolali |
40 |
|
Total |
240 |
Data were collected through direct interviews with farmer respondents, complemented by observations of farmer groups and their activities. The information gathered included farmer characteristics, land ownership status, use of agricultural inputs, household income and expenditures, as well as environmental awareness. These data serve as the basis for evaluating the welfare of farming households in the Bengawan Solo Watershed.
2.3. Analysis Techniques
Analysis techniques in farming refer to the methods or approaches used to assess and understand the conditions, performance, efficiency, and well-being of farmers. These techniques involve measuring various aspects such as income, consumption, education, health, and access to resources. Through such analyses, researchers can contribute to improving the living standards of farming communities (Nandy & Singh, 2020). In analyzing welfare, several analytical tools can be employed, as illustrated in Figure 1.
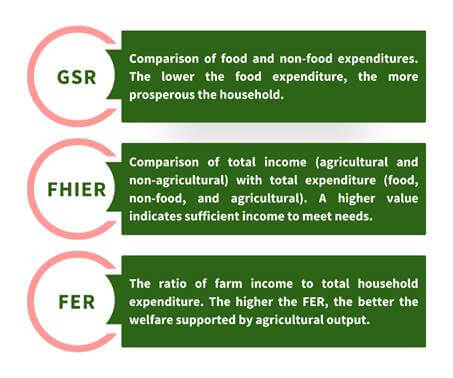
Figure 1. Analysis Techniques.
(1) Good Service Ratio (GSR)
Good service ratio (GSR) is an indicator applied to assess the level of farmers’ ability to meet their living needs from farming income (Asante et al., 2025). GSR can be calculated by comparing the food expenditure and the non-food expenditure of farmer households (Rahayu et al., 2023). The GSR is crucial because it reflects the level of farmer welfare. Furthermore, the GSR can be calculated using the following formula:
|
|
(1) |
GSR > 1 (Less Prosperous), indicating a heavier economic burden on farming households because food expenditures exceed non-food expenditures.
GSR = 1 (Prosperous), indicating a household balance between food and non-food expenditures.
GSR < 1 (More Prosperous), indicating that farming households spend more on non-food needs than on food needs.
(2) Farmer Household Income Exchange Rate (FHIER)
The Farmer Household Income Exchange Rate (FHIER) is an indicator used to evaluate the welfare level of farming households by comparing household income with household expenditure (Priyadi et al., 2020). Farmer household income and expenditure are crucial in determining the FHIER value. Higher incomes also increase the potential for a farm household’s welfare index to increase (Angelica et al., 2025). Then, the FHIER index can be formulated as follows:
|
|
(2) |
FHIER > 1 (Surplus): Indicates that the farmer’s household income is higher than its expenses. An FHIER value > 1 indicates the financial stability of the farmer’s household.
FHIER < 1 (Deficit): Indicates that the farmer’s household expenses are higher than its income. This indicates that an FHIER value < 1 indicates a financial burden on the farmer’s household (Ahdika et al., 2021).
(3) Farmers Exchange Rate (FER)
The Farmers’ Exchange Rate (FER) is an indicator used to assess farmers’ purchasing power by comparing farm income with total household expenditure. This measure is critical as it directly reflects the welfare of farming households (Ramadhanu et al., 2021). A higher FER value indicates that farm income is sufficient to cover household expenses, whereas a lower FER value suggests economic vulnerability, with farmers struggling to meet basic needs (Pratiwi et al., 2020). The FER is calculated using the following formula:
|
|
(3) |
FER > 100 (Surplus) indicates that production prices are rising faster than consumption prices, resulting in farmers’ income exceeding their expenses.
FER = 100 (Break-even) indicates that farmers’ income is balanced with their expenses, meaning they are in a break-even state.
FER < 100 (Deficit) indicates that farmers’ consumption is rising higher than production prices, resulting in farmers’ income being less than their expenses.
3. Results
3.1. Characteristics of Farmers
Farmer characteristics provide a depiction of the actual conditions and inherent attributes of farmers, which influence farm management practices and the level of prosperity achieved (Bogdan & Kulshreshtha, 2020). These characteristics are commonly classified based on factors such as gender, age, household size, educational attainment, and other socio-demographic variables (Lillo et al., 2025).
Studies in agriculture show that gender has become an important factor that plays a role in agricultural practices and access to resources (Fasakin et al., 2023). Table 2 shows the gender distribution of farmers in the Bengawan Solo watershed, showing that the majority of farmers are men, totaling 200, or 83.33%, while female farmers are only 40, or 16.67%. This distribution indicates that male participation in agricultural activities is significantly more dominant than female participation. The gender distribution of farmers in this study is nearly identical to the results of research conducted by Mwalyagile et al. (2024) in Tanzania, which also reported a higher proportion of male farmers. Male dominance in agriculture is often attributed to the physically demanding nature of farming and men’s relatively easier access to land and productive resources, factors that frequently limit women’s involvement (Sedegah, 2025).
Table 2. Characteristics of Farmers.
|
Variable |
Frequency |
Percentage (%) |
|
Gender |
||
|
Male |
200 |
83.33 |
|
Female |
40 |
16.67 |
|
Total |
240 |
100.00 |
|
Age (Year) |
||
|
21–42 |
36 |
15.00 |
|
43–64 |
133 |
55.42 |
|
65–86 |
71 |
29.58 |
|
Total |
240 |
100.00 |
|
Family Member |
||
|
1–3 |
121 |
50.42 |
|
4–7 |
118 |
49.17 |
|
8–11 |
1 |
0.41 |
|
Total |
240 |
100.00 |
|
Education Level |
||
|
Elementary School |
95 |
39.58 |
|
Middle School |
45 |
18.75 |
|
High School |
71 |
29.58 |
|
College |
15 |
6.25 |
|
Not in School |
14 |
5.84 |
|
Total |
240 |
100.00 |
|
Farming Experience (Year) |
||
|
1–24 |
127 |
52.92 |
|
25–48 |
86 |
35.83 |
|
49–72 |
27 |
11.25 |
|
Total |
240 |
100.00 |
|
Land Size (m2) |
||
|
235–5,490 |
185 |
77.08 |
|
5,491–10,746 |
48 |
20.00 |
|
10,747–16,002 |
7 |
2.92 |
|
Total |
240 |
100.00 |
|
Land Ownership |
||
|
Alone |
206 |
85.83 |
|
Rent |
34 |
14.17 |
|
Sharing |
0 |
0.00 |
|
Total |
240 |
100.00 |
Farmer age is a key factor influencing experience, productivity, and the capacity to manage agricultural activities effectively (Qiao & Liu, 2020). In Table 2, the majority of farmers in the Bengawan Solo Watershed are in the 43–64 age group, 133 people (55.42%), indicating that most farmers are of productive age. Meanwhile, 71 farmers, or 29.58%, are in the 65–56 age group, and only 36, or 15.00%, are in the 21–42 age group. These findings suggest limited participation from the younger generation, with middle-aged and older farmers comprising the majority of the workforce. This study shows that the majority of farmers are in the age category of 40 years or more, comparable to that targeted in the study by Maman et al. (2022), which has similar results. Several factors contribute to the low involvement of younger people in agriculture, including negative perceptions of farming as a labor-intensive and less profitable occupation (Giwu et al., 2024).
Household size is an important factor influencing the economic responsibilities that farmers must bear (Bitana et al., 2024). In Table 2, the majority of farmers have families ranging from 1–3 people (121 farmers, or 50.42%), with 118 farmers (49.17%) having families with 4–7 people. Meanwhile, only one farmer has a family of 8–11 people. These data indicate that the majority of farmers in the Bengawan Solo watershed have small to medium-sized families. The data in this study are almost in line with the research of Istiyanti et al. (2024) found that most farmers in Kulonprogo have an average family size of 1–3 people. With relatively small household sizes, the economic obligations of farmers remain moderate and aligned with the household’s capacity to meet daily needs (Stratton et al., 2020).
One of the important factors influencing farm management is the level of farmer education. The level of education is very useful in increasing agricultural production results (Hasanah et al., 2021). Higher education enhances farmers’ ability to access information, adopt technology, and capitalize on business opportunities (Sharma & Bhambri, 2024). From the data presented in Table 2, the majority of respondents in the Bengawan Solo Watershed were at the elementary school level, 95 people (39.58%), making this group the largest. Meanwhile, the lowest number was in the Not in School category, with 14 people (5.83%). This data shows that although some farmers only received a low level of education, the majority had completed elementary to secondary education, with quite a few farmers even reaching high school and university. Farmers who have received a proper education often receive support in the form of understanding of innovation, information, and technology related to agriculture (Oli et al., 2025).
Farming experience is an important aspect that reflects a farmer’s skills and knowledge in managing a farm. Greater experience generally enhances farmers’ ability to overcome challenges, make informed decisions, and adapt to changing conditions (Habtemariam et al., 2020). Based on Table 2, the majority of farmers in the Bengawan Solo Watershed have experience ranging from 1-24 years, namely 127 people or 52.92%, indicating a dominance of farmers with relatively short to medium experience. Then, there are 86 people or 35.83% who have 25–48 years of experience, and only 27 people or 11.25% have 49–72 years of experience. These results suggest that the majority of farmers possess limited to moderate experience, with relatively few having long-term expertise. This limited experience may restrict their ability to apply advanced farm management strategies, making them more reliant on traditional practices or support from agricultural extension services (To-The et al., 2025).
Land size is a critical determinant of agricultural production capacity. Farmers with larger holdings have greater opportunities to increase yields and income, while those with smaller plots often face operational and economic constraints (Kumar & Moharaj, 2023). From Table 2, the majority of farmers in the Bengawan Solo Watershed own land areas of 235–5,490 m² (185 people; 77.08%), while the fewest own land areas of 10,747–16,002 m² (only 7 people; 2.92%). These findings indicate that most farmers operate on small-scale landholdings, which may restrict productivity and limit household income (Mathinya et al., 2022).
Land ownership status indicates the pattern of land ownership by farmers, whether the land is owned, leased, or held through a profit-sharing system. This pattern influences the farmer’s level of independence and the costs they must bear in the farming process (Akber et al., 2024). Based on the data in Table 2, the majority of farmers in the Bengawan Solo Watershed own their own agricultural land, with a total of 206 people or 85.83%. Meanwhile, 34 people, or 14.17% of farmers, manage their land by renting. No farmers use a profit-sharing system, so the land ownership pattern is dominated by farmers who own their own land and a small number who rent. This pattern reflects a predominance of private ownership, which generally provides more stable economic returns compared to rented land, where production costs tend to be higher and income less secure (Geng et al., 2021).
3.2. Cost
3.2.1. Farming Input Costs
Farming input costs represent all expenditures incurred by farmers to procure agricultural production facilities required before and during the rice cultivation process (Ibañez et al., 2024). Farming input costs include several components such as seeds, fertilizers, and pesticides. These components play a direct role in determining the quality and quantity of the harvest (Bailly & Roldan, 2023). Careful analysis of input costs enables farmers to manage expenditures more efficiently, ensuring that each investment contributes to optimal improvements in yield and overall productivity.
Fertilizer is a critical input in rice farming, as it enhances soil fertility and supports plant growth and productivity. Based on Table 3, the total average cost of agricultural production inputs incurred by farmers in the Bengawan Solo watershed area reached IDR 3,205,599. Then, in the seed component, the highest cost was spent on Mapan varieties (05 & 25) at IDR 387,938, while the smallest was Hybrid Rice with a cost of IDR 21,000. For fertilizers, the highest expenditure was on chemical fertilizers with a cost of IDR 1,715,169, while the lowest was on liquid organic fertilizer at IDR 4,770. As for pesticides, the highest cost was allocated to chemical pesticides, worth IDR 279,162, while the smallest was organic pesticides, with a cost of only IDR 750.
Table 3. Farming Input Costs for a Year.
|
Production Facilities |
Costs (IDR) |
Percentage (%) |
|
Seed Varieties |
|
|
|
Inpari (32, 35, & 64) |
49,092 |
1.56 |
|
Mapan (05 & 25) |
387,938 |
12.35 |
|
Ciherang |
52,000 |
1.66 |
|
Hibrida |
21,000 |
0.67 |
|
Mentik (Wangi & Susu) |
60,000 |
1.91 |
|
Logawan |
51,000 |
1.62 |
|
PP/P2 |
227,001 |
7.23 |
|
Mengkongga |
36,000 |
1.18 |
|
Segreng |
51,000 |
1.62 |
|
Sidenok |
90,000 |
2.87 |
|
Situagendit |
45,000 |
1.43 |
|
Total Seed Varieties |
1,070,031 |
34.08 |
|
Fertilizer |
|
|
|
Chemical Fertilizers |
1,715,169 |
54.64 |
|
Animal Manure |
16,251 |
0.52 |
|
Liquid Organic Fertilizers |
4,770 |
0.15 |
|
Solid Organic Fertilizers |
53,001 |
1.69 |
|
Total Fertilizer |
1,789,191 |
57.00 |
|
Pesticides |
|
|
|
Chemical Pesticides |
279,162 |
8.89 |
|
Organic Pesticides |
750 |
0.03 |
|
Total Pesticides |
279,912 |
8.92 |
|
Total Farming Inputs Costs |
3,139,134 |
100.00 |
In general, these findings indicate that farmer expenditures in the Bengawan Solo watershed remain heavily concentrated on chemical fertilizers and selected seed varieties, while spending on organic fertilizers and pesticides remains minimal. This pattern suggests a strong dependence on chemical inputs to sustain agricultural productivity, consistent with the observations of Hasibuan et al. (2022).
3.2.2. Depreciation Cost
Depreciation costs represent the reduction in the value of fixed assets, such as agricultural tools and machinery, over their useful life due to wear, aging, or other technical factors (Schroers et al., 2020). These costs are typically calculated by subtracting the residual value of an asset from its initial value and dividing the result by its economic lifespan, thereby yielding the annual depreciation expense (Arata et al., 2025). The existence of depreciation costs is very important because it can affect the calculation of overall production costs, where the greater the depreciation value, the greater the total farming costs, and ultimately, can reduce the net profits received by farmers (Sampaio et al., 2021).
As shown in Table 4, the depreciation costs of agricultural equipment in the Bengawan Solo Watershed, it can be seen that the largest depreciation is found in sprayers with an average value of IDR 71,312 or approximately 49.08% of the total depreciation cost. Meanwhile, the smallest depreciation is found in other harvesting equipment with an average value of IDR 335 or 0.23%, so their contribution to the total depreciation cost is relatively small. This indicates that sprayers are the equipment that bears the largest depreciation burden, while harrows have almost no significant impact.
Table 4. Equipment Depreciation Costs for a Year.
|
Types of Equipment |
Amount (IDR) |
Percentage (%) |
|
Hoe |
27,891 |
19.20 |
|
Sickle |
30,623 |
21.08 |
|
Sprayer |
71,312 |
49.08 |
|
Weigher |
1,152 |
0.79 |
|
Shovel |
1,104 |
0.76 |
|
Harrow |
663 |
0.46 |
|
Tractor |
12,223 |
8.40 |
|
Other Harvesting Equipment |
335 |
0.23 |
|
Total Depreciation Cost |
145,303 |
100.00 |
3.2.3. Labor Costs
In agriculture, labor costs constitute a major component of the production cost structure, as nearly every stage of farming requires human or mechanical labor (Vaňová et al., 2024). Labor costs include workers’ wages, overtime costs, operational costs for the use of machinery or other agricultural tools, as well as allowances or other facilities provided to workers during the farming business (Frahan et al., 2024).
Table 5 shows that labor costs in the Bengawan Solo Watershed, the highest labor costs are found in harvesting activities, totaling IDR 3,154,362, while the lowest are in post-harvest activities, at only IDR 5,625. This indicates that harvesting is the most labor-intensive stage of rice farming, while post-harvest activities require minimal labor input. In addition, planting and land preparation also represent substantial cost components, with planting expenses being relatively high due to the large workforce required at this stage (Jumpah et al., 2024). Land preparation, by contrast, relies more heavily on machinery to improve efficiency (Li et al., 2024).
Table 5. Labor Costs for a Year.
|
Description |
Non-Family Labor (WH) |
Labor Cost (IDR) |
Machine (IDR) |
Total (IDR) |
|
Land Preparation |
0.85 |
644,250 |
1,239,375 |
1,883,625 |
|
Planting |
8.17 |
2,235,999 |
0 |
2,235999 |
|
Weeding |
0.30 |
145,251 |
1,875 |
147,126 |
|
Harvesting |
4.38 |
2,091,237 |
1,063,125 |
3,154,362 |
|
Post-Harvest |
0.01 |
5,625 |
0 |
5,625 |
|
Transportation |
0.10 |
96,501 |
51,249 |
147,750 |
|
Total Labor Cost |
13.81 |
5,218,863 |
2,355,624 |
7,574,487 |
*WH (Working Hour)
3.2.4. Other Costs
In addition to major inputs such as seeds, fertilizers, labor, and depreciation, farming also incurs other costs that fall into the category of indirect expenses (Mamadiyarov et al., 2023). These costs include indirect expenses, such as administrative costs or other unforeseen expenses (Baraka et al., 2021). Although relatively small in nominal value, these costs still contribute to total production expenses and must be considered to ensure more efficient farm management.
Other costs in farming in the Bengawan Solo Watershed are dominated by expenditures for Indirect Taxes, with an average of IDR 600,000 per year, while the lowest is the cost of Spare Parts Maintenance, with an average of only IDR 117,500 per year (Table 6). These findings suggest that tax obligations, although indirect, represent the most significant additional financial burden for farmers in the Bengawan Solo Watershed, whereas their maintenance costs contribute minimally to overall expenditures. Such costs, though secondary, still raise total production expenses and may reduce farmers’ profit margins, thereby lowering overall farming efficiency (Baraka et al., 2021).
Table 6. Other Costs for a Year.
|
Other Costs |
Amount (IDR) |
|
Spare Parts Maintenance |
117,500 |
|
Indirect Taxes |
600,000 |
|
Farmers Group Membership Fees |
240,000 |
|
Internet/Credit/Data |
500,000 |
|
Other Expenses |
260,000 |
|
Total Other Costs |
1,717,500 |
3.2.5. Total Costs
In a farming enterprise, total costs represent the cumulative sum of all expenses incurred by farmers throughout the production process (Sultan et al., 2021). In general, costs are categorized into two types: fixed costs and variable costs. Fixed costs refer to expenditures that remain unchanged regardless of the level of production, whereas variable costs encompass expenses that fluctuate in accordance with changes in the level of output.
Based on Table 7, the total expenditures of farmers in the Bengawan Solo Watershed, it can be observed that the overall cost incurred amounts to IDR 12,576,424. The largest portion of the expenses comes from labor costs, totaling IDR 7,574,487, while the smallest portion is attributed to equipment depreciation costs, amounting to IDR 145,303. This indicates that the farming cost structure in the Bengawan Solo Watershed shows a higher concentration of expenses allocated to labor wages, whereas the cost of asset depreciation contributes the least to the total expenditure.
Table 7. Total Costs.
|
Types of Costs |
Amount (IDR) |
|
Total Farming Inputs Costs |
3,139,134 |
|
Total Depreciation Cost |
145,303 |
|
Total Labor Costs |
7,574,487 |
|
Total Other Costs |
1,717,500 |
|
Total Costs |
12,576,424 |
3.3. Farmer Household Income
Farmer household income encompasses all earnings derived from both agricultural and non-agricultural activities (Hariyanto et al., 2021). These may include revenues from the sale of agricultural products, wages from off-farm employment, or income from secondary businesses (Octavio et al., 2024). The size of a farmer’s household income greatly determines the welfare of the farmer’s household, because it will affect their ability to meet their daily needs (Aleksandrova et al., 2024).
Table 8 indicates that farmer household income in the Bengawan Solo Watershed, the highest source of income from the agricultural sector comes from rice farming with an average of IDR 35,416,789 (71.05%), while the lowest is from livestock with an average of IDR 1,538,333 (3.09%). Then, in non-agricultural income, the largest source comes from laborers with an average of IDR 7,044,167 (14.13%), while the lowest is from drivers with an average of only IDR 75,000 (0.15%). These findings demonstrate that farming households in the Bengawan Solo Watershed remain heavily dependent on agriculture, particularly rice cultivation, as their primary source of livelihood, as reflected in Figure 2, which shows that agricultural activities account for 74.14% of total household income, compared to 25.86% from non-agricultural sources. This dependence is largely shaped by limited access to non-agricultural employment opportunities, low skill levels outside the farming sector, and strong cultural and hereditary ties to land management (Sumaryanto et al., 2021).
Table 8. Farmer Household Income for a Year.
|
Type of Income |
Amount (IDR) |
Percentage (%) |
|
Agriculture |
|
|
|
Rice Farming |
35,416,789 |
71.05 |
|
Livestock |
1,538,333 |
3.09 |
|
Total Agriculture |
36,955,122 |
74.14 |
|
Non-Agriculture |
|
|
|
Laborer |
7,044,167 |
14.13 |
|
Trader |
2,314,300 |
4.64 |
|
Furniture Maker/Carpenter |
1,078,333 |
2.16 |
|
Tailor |
125,000 |
0.25 |
|
Teacher |
250,000 |
0.50 |
|
Civil Servant |
830,000 |
1.67 |
|
Retiree |
525,000 |
1.05 |
|
Self-Employed |
426,000 |
0.85 |
|
Village Government Employee |
222,000 |
0.45 |
|
Driver |
75,000 |
0.15 |
|
Total Non-Agriculture |
12,889,800 |
25.86 |
|
Total Farmer Household Income |
49,844,922 |
100.00 |

Figure 2. Farmer Household Income.
3.4. Farmer Household Expenditure
Farmer household expenditure refers to the total costs incurred by farming families to meet daily living needs (Hariyanto et al., 2021). In general, expenditure is divided into two main categories, namely, food expenditure, such as rice, side dishes, vegetables, and other consumption needs, and non-food expenditure, which includes education costs, health, transportation, and other social needs (Kaur et al., 2023). The level of household expenditure greatly influences the economic conditions of farmers, because expenditure that is greater than income will suppress purchasing power, savings, and the ability of farmers to develop their farming businesses (Shafi et al., 2021).
As presented in Table 9, farmer household expenditures in Bengawan Solo Watershed are predominantly allocated to non-food needs, with an average of IDR 16,767,301, much larger compared to food category expenditure, which is only IDR 6,353,760. The largest component of the non-food category comes from others, amounting to IDR 3,197,433, while in the food category, the largest component comes from side dishes, amounting to IDR 2,534,868. Meanwhile, the smallest component of non-food expenditure comes from the health category, amounting to IDR 230,448, then the smallest component of food expenditure is the rice category, amounting to IDR 38,448. Overall, the total expenditure of farmer households reaches IDR 35,697,485, which shows that non-food needs have a larger amount compared to food needs, as also illustrated in Figure 3, where non-food expenditures account for 72.52% of total household spending, while food expenditures comprise only 27.48%. Therefore, non-food expenditure is the main factor that influences the economic condition of farmer households. (Table 9)
Table 9. Farmer Household Expenditure for a Year.
|
Type of Production |
Amount (IDR) |
Percentage (%) |
|
Food |
|
|
|
Rice |
38,448 |
0.17 |
|
Vegie & Fruit |
870,396 |
3.76 |
|
Side Dishes |
2,534,868 |
10.96 |
|
Spice |
1,831,308 |
7.92 |
|
Drink |
269,820 |
1.17 |
|
Snack |
808,920 |
3.50 |
|
Total Food |
6,353,760 |
27.48 |
|
Non-Food |
|
|
|
Lighting and Fuel |
3,918,456 |
16.95 |
|
Tax |
2,585,532 |
11.18 |
|
Communication |
1,095,744 |
4.74 |
|
Family |
3,429,036 |
14.83 |
|
Daily necessities |
1,176,900 |
5.09 |
|
Health |
230,448 |
1.00 |
|
Social |
1,133,750 |
4.90 |
|
Others |
3,197,433 |
13.83 |
|
Total non-food |
16,767,301 |
72.52 |
|
Food & Non-Food Expenditures |
23,121,061 |
100.00 |
|
Agricultural & Non-Agricultural Expenditures |
12,576,424 |
|
|
Total Expenditures |
35,697,485 |
|

Figure 3. Food and Non-Food Expenditures.
3.5. Standard of Living of Farmer Households Based on Welfare Level
3.5.1. Good Service Ratio (GSR)
GSR, or the Good Service Ratio, is an indicator used to compare food and non-food expenditures in farming households. Food expenditures cover daily necessities, staples, side dishes, snacks, drinks, and more. Non-food expenditures include other costs such as taxes, transportation, healthcare, education, and more.
From the results of the Good Service Ratio (GSR) analysis presented in Table 10, it can be seen that food-related expenditures amount to IDR 6,353,760, while non-food expenditures reach IDR 16,767,301. The GSR calculation for farmers in the Bengawan Solo watershed yielded a value of 0.38. This value indicates that rice farming households in the Bengawan Solo watershed in Central Java are relatively prosperous. A GSR value below 1 indicates that household income is sufficient not only to cover food consumption but also to allocate a greater share of expenditures toward non-food needs, reflecting a higher level of welfare. These findings contrast with the results reported by Rahayu et al. (2023), who explained that the welfare analysis of red rice farmers in Gunung Kidul, measured using the Good Service Ratio, yielded a value of 1.13, indicating that these farmers fall into the non-prosperous category.
Table 10. Analysis Good Service Ratio.
|
Description |
Amount |
|
Food Expenditure (IDR) |
6,353,760 |
|
Nod-food Expenditure (IDR) |
16,767,301 |
|
Good Service Ratio < 1 |
0.38 |
3.5.2. Farmer Household Income Exchange Rate (FHIER)
The Farmers Household Income and Expenditure Ratio, or FHIER, is an indicator used to compare a farmer’s household income to its total expenses. This value reflects the extent to which income is able to cover the farmer’s living expenses. The FHIER is obtained by comparing total income and total expenses.
Based on the results of the Farmer Household Income Exchange Rate (FHIER) analysis presented in Table 11, it is observed that the total income of farmers in the Bengawan Solo watershed amounts to IDR 49,844,922, while the total expenditure reaches IDR 35,697,485. The FHIER was calculated at 1.40. Since the value is greater than 1, this indicates that farming households in the Bengawan Solo Watershed earn incomes that exceed their total expenditures. An FHIER above 1 reflects financial stability, demonstrating that households are able to cover their living costs while maintaining a surplus. The analysis in this study is consistent with the findings of Priyadi et al. (2020), who reported an FHIER value of 1.28, indicating that farmers were experiencing a surplus.
Table 11. Analysis of Farmer Income Exchange Rate.
|
Description |
Amount |
|
Total Income (IDR) |
49,844,922 |
|
Total Expenditure (IDR) |
35,697,485 |
|
FHIER |
1.40 |
3.5.3. Farmers Exchange Rate (FER)
The Farmers Exchange Rate (FER) is an indicator that describes a farmer’s ability to cover household needs through farm income. The Farmers’ Exchange Rate is the ratio of farm income to total expenses paid by farmers (inputs and consumption), which is used as an indicator of farmer welfare.
Based on Table 12 of the Farmers’ Exchange Rate (FER) analysis for farmers in the Bengawan Solo watershed, it is shown that the farming income amounts to IDR 35,416,789, while the total expenditure reaches IDR 35,697,485. The FER was calculated at 99.21. Since this value is below the threshold of 100, it indicates that household consumption exceeds production income, meaning that farmers’ earnings from agricultural activities are insufficient to cover total expenses. This condition reflects a low level of welfare, as farming households face a significant income expenditure deficit. In other words, this indicates that the farming activities carried out have not yet generated optimal profits, and therefore, the welfare of the farmers has not been fully achieved. However, the findings of this study are not consistent with those reported by Syaharuddin et al. (2021), in which the standard FER value was 118.76, indicating that farmers in West Nusa Tenggara were experiencing a surplus.
Table 12. Analysis of Farmers’ Exchange Rate.
|
Description |
Amount |
|
Farming Income (IDR) |
35,416,789 |
|
Total Expenditure (IDR) |
35,697,485 |
|
Farmers Exchange Rate < 100 |
99.21 |
4. Discussion
The results reveal a complex welfare condition among rice farmer households in the Bengawan Solo Watershed. The Good Service Ratio (GSR) value of 0.38 indicates that the household expenditure is more heavily allocated to non-food needs than food needs. However, this expenditure pattern is not solely supported by income from rice, such as off-farm and non-farm employment, which contribute significantly to activities. This finding suggests that the welfare of rice farmer households in the Bengawan Solo Watershed is highly dependent on income diversification beyond agricultural production. These findings are consistent with the study conducted by Triyono & Berliani Arifianikmah (2024), which found that farmers in Candibinangun Village were categorized as prosperous, with a GSR value of 0.98.
Meanwhile, the Farmer Household Income Exchange Rate (FHIER) among farmers in the Bengawan Solo Watershed was 1.40, indicating that household income is higher than total household expenditure. This suggests that rice farmer households in the Bengawan Solo Watershed are in a surplus condition. The FHIER value also strengthens the evidence that income from various sources, both agricultural and non-agricultural, helps maintain the economic stability of farming households. The findings of this study are consistent with those reported by Triyono and Berliani Arifianikmah (2024), who found an FHIER value of 1.41, showing that farmers in Candibinangun Village achieved a good level of welfare.
However, the results of the Farmers’ Exchange Rate (FER) analysis show a value of 99.21, indicating that income derived solely from rice farming is insufficient to cover the total household expenditures of rice farmers in the Bengawan Solo Watershed. In other words, farmers are still experiencing a deficit in the agricultural sector, and reliance solely on agricultural income has not yet guaranteed household welfare. The condition of farmers in the Bengawan Solo Watershed is consistent with the findings of Ramadhanu et al. (2021), which explained that a low FER is often caused by high agricultural production costs, rising input prices, and farmers’ dependence on chemical fertilizers and labor.
The apparent contradiction between the positive GSR (0.38) and FHIER (1.40) values and the deficit FER (99.21) reveals a critical vulnerability in the welfare of rice farmer households in the Bengawan Solo Watershed. Although household welfare appears relatively stable when total income is considered, this condition is largely sustained by income diversification, particularly from non-agricultural sources, which account for a substantial share of household income. The FER value below 100 indicates that income derived solely from rice farming remains insufficient to cover household expenditures, highlighting that agricultural activities alone have not yet ensured sustainable household welfare. Consequently, farmers’ economic stability is fragile and highly vulnerable to potential disruptions in off-farm and non-farm employment opportunities.
This condition is closely related to structural challenges in the Bengawan Solo Watershed. Previous studies have documented that seasonal flooding, suboptimal water management, and soil degradation have limited rice productivity and increased production risks in this region, thereby reducing the profitability of rice farming. As a result, farmers are compelled to rely on income diversification strategies to maintain household welfare. The low FER observed in this study, therefore, reflects not only farm-level economic inefficiency but also broader environmental and infrastructural constraints that continue to undermine the sustainability of rice-based livelihoods in the Bengawan Solo Watershed.
Furthermore, the expenditure structure of farmers is still dominated by labor costs and chemical inputs, indicating that production efficiency has not yet reached an optimal level. The high use of chemical fertilizers and pesticides also demonstrates the limited application of environmentally friendly agricultural technologies and the lack of farm diversification. This highlights the importance of enhancing farmers’ capacity through agricultural extension programs and government support in promoting sustainable agricultural technologies (Nath et al., 2023).
Farmer welfare is also influenced by socio-economic characteristics such as age, education level, farming experience, and land ownership status. The majority of farmers are within the productive age range (43–64 years) and have attained basic to secondary education levels, which can serve as valuable assets in adopting technological innovations and modern farming practices. However, the relatively low participation of younger generations remains a significant challenge for the sustainability of the agricultural sector in the Bengawan Solo Watershed region.
Overall, this study reveals that the welfare of rice farmer households in the Bengawan Solo Watershed is primarily sustained through income diversification rather than agricultural profitability alone. The strong dependence on non-agricultural income sources exposes farming households to significant economic vulnerability, as disruptions in off-farm employment opportunities could rapidly undermine household welfare despite the currently positive GSR and FHIER values. Furthermore, environmental constraints specific to the Bengawan Solo Watershed, such as seasonal flooding, water management challenges, and soil degradation, contribute directly to the low profitability of rice farming, as reflected in the FER value of 99.21. These findings underscore the need for integrated policy interventions that not only improve production cost efficiency and adopt modern farming technologies but also strengthen farmer organizations and promote more resilient livelihood strategies to support sustainable farmer welfare.
This study has several limitations. First, the analysis relies on cross-sectional data, which may not fully capture temporal variations in farmer welfare and income dynamics, particularly in relation to seasonal flooding and climate variability in the Bengawan Solo Watershed. Second, the welfare assessment is limited to three indicators (GSR, FHIER, and FER), which may not fully reflect other social and institutional dimensions of farmer welfare. Future research is encouraged to employ longitudinal data, incorporate additional welfare indicators, and examine the role of institutional support, climate adaptation strategies, and market access in shaping the long-term welfare of rice farmers.
5. Conclusion
Based on the discussion, the welfare of rice farmers in the Bengawan Solo Watershed reflects a complex condition characterized by a strong dependence on non-agricultural income sources rather than agricultural activities alone. The annual household income of rice farmers in the Bengawan Solo Watershed, Central Java, reaches IDR 49,844,922, consisting of IDR 36,955,122 derived from the agricultural sector and IDR 12,889,800 from non-agricultural activities. Meanwhile, total household expenditure amounts to IDR 35,697,485 per year, including food, non-food, agricultural, and non-agricultural expenditures, indicating that household welfare is maintained through a combination of multiple income sources rather than rice farming profitability alone.
This condition indicates a surplus between household income and expenditure. The GSR value of 0.38 shows that food expenditure is lower than non-food expenditure, reflecting a consumption pattern associated with the fulfillment of secondary needs. In addition, the FHIER value of 1.40 indicates that total household income is sufficient to cover overall expenditures. Critically, however, the FER value of 99.21 demonstrates that income derived solely from rice farming is insufficient to meet household expenses, revealing that farmer welfare is heavily dependent on off-farm and non-agricultural income sources. This dependence creates significant economic vulnerability, as any disruption to non-agricultural employment opportunities could rapidly threaten the welfare of rice farmer households in the Bengawan Solo Watershed.
Overall, while farming households are generally able to meet their needs, as confirmed by the GSR and FHIER, the low FER highlights the need for innovation and diversification of income sources. Given the critical role of off-farm income in maintaining household welfare and the environmental challenges specific to the Bengawan Solo Watershed, policy interventions must address both improvements in agricultural productivity and livelihood diversification strategies to ensure sustainable farmer welfare.
Therefore, policy interventions should be specifically directed at addressing the low FER value (99.21), which indicates that income from rice farming alone is insufficient to sustain household welfare. Targeted measures are required to reduce production costs and improve income efficiency, such as input subsidy schemes for fertilizers and seeds, extension services focused on cost-efficient and climate-resilient rice farming practices, and improved access to affordable agricultural credit. In parallel, considering the strong dependence on off-farm income, livelihood diversification strategies should be strengthened through the development of non-rice agricultural activities and rural non-farm employment opportunities. Strengthening farmer organizations and cooperatives is also essential to enhance farmers’ bargaining power, market access, and resilience to economic shocks, particularly in the flood-prone Bengawan Solo Watershed. These integrated policy measures are expected to support sustainable livelihoods, improve regional productivity, and enhance food security in the long term.
CRediT Author Statement: Nur Rahmawati: Conceptualization, Data curation, and Writing original draft; Chelsea Anindita: Data curation and Writing original draft; Zuhud Rozaki: Conceptualization; Triyono: Conceptualization.
Data Availability Statement: The data supporting the findings of this study are not publicly accessible but can be obtained from the corresponding author upon reasonable request.
Conflicts of Interest: The authors declare no conflict of interest.
Funding: This research was funded by the Ministry of Higher Education, Science and Technology of the Republic of Indonesia, under the Directorate of Research and Community Service program (Contract Nos. 126/C3/DT.05.00/PL/2025; 0498.07/LL5-INT/AL.04/2025; 30/KP-DRP-RISET/VI/2025).
Informed Consent Statement: Informed consent was obtained from all subjects involved in the study.
Acknowledgments: The authors gratefully acknowledge the Ministry of Higher Education, Science and Technology, Republic of Indonesia, for providing financial support through the internal research grant program. The views expressed in this article are solely those of the authors and do not necessarily reflect the official position of the funding agency. During the preparation of this work, the author used CHATGPT in order to enhance the clarity of the analysis, optimize the flow of the article, and refine the overall style and clarity of the article. The author have reviewed and edited the content as needed. The author will take full responsibility for the content of the published article.
Abbreviations
The following abbreviations are used in this manuscript:
|
GSR |
Good Service Ratio |
|
FHIER |
Farmer Household Income Exchange Rate |
|
FER |
Farmers Exchange Rate |
|
IDR |
Indonesian Rupiah |
References
Ahdika, A., Rosadi, D., Effendie, A. R., & Gunardi. (2021). Household margin insurance of agricultural sector in
Indonesia using a farmer
exchange rate index. Agricultural Finance Review, 81(2), 169–188.
https://doi.org/10.1108/AFR-11-2019-0117
Akber, N., Paltasingh, K. R., Mishra, A. K., & Goyari, P. (2024).
Land ownership security, farm investment, and investment risk in Indian
agriculture: Evidence from nationally representative survey.
Journal of Agricultural and Applied Economics, 56(2), 278–296. https://doi.org/10.1017/AAE.2024.9
Aleksandrova, O., Azadi, H., Värnik, R., Nurmet, M., & Viira, A.-H. (2024). The determinants of farm income variability: Evidence from
Estonia. German Journal of Agricultural Economics, 73(3). https://doi.org/10.52825/gjae.v73i3.2549
Angelica, P. A., Hariyati, Y., Pradana, A. P., Winarso, S., Sudarko, & Sofia. (2025). The welfare level of horticulture farmer households with farmer household income exchange rate (NTPRP). IOP Conference Series: Earth and Environmental Science, 1497, 012045. https://doi.org/10.1088/1755-1315/1497/1/012045
Arata, E., Shimogawa, T., & Inohara, T. (2025). Analysis of depreciation methods based on cooperative game theory — Focusing on the straight-line method. International Game Theory Review, 27(1). https://doi.org/10.1142/S0219198924500130
Asante, B. O., Prah, S., Addai, K. N., Anang, B., & Ng’ombe, J. N.
(2025). Agricultural services and rural household welfare: Empirical
evidence from Ghana. International Journal of Social Economics, 52(2),
157–176.
https://doi.org/10.1108/IJSE-11-2022-0745
Bailly, C., & Roldan, M. V. G. (2023). Impact of climate perturbations on seeds and seed quality for global agriculture. Biochemical Journal, 480(3), 177–196. https://doi.org/10.1042/BCJ20220246
Baraka, B., Mburu, J., & Muriithi, B. (2021). Transaction costs
magnitudes, market participation, and smallholder profitability in rural-urban
vegetable supply chain. International Journal of Vegetable Science, 27(1),
54–64.
https://doi.org/10.1080/19315260.2019.1700204
Bitana, E. B., Lachore, S. T., & Utallo, A. U. (2024). The influence of household size on socioeconomic conditions of rural farm households in Damot Woyde District, Wolaita Zone, Southern Ethiopia. Cogent Social Sciences, 10(1), 2358153. https://doi.org/10.1080/23311886.2024.2358153
Bogdan, A.-M., &
Kulshreshtha, S. N. (2020). Canadian horticultural growers’ perceptions of
beneficial management practices for improved
on-farm water management. WIT Transactions on Ecology and the Environment,
245, 61–72.
https://doi.org/10.2495/EID200071
Fasakin, O. A., Ajayi, O. E., & Olajide, O. A. (2023). Gender disparity in cocoa production resource access and food security in Ogun State, Nigeria. African Journal of Food, Agriculture, Nutrition and Development, 23(9), 24560–24583. https://doi.org/10.18697/AJFAND.124.22350
Frahan, A. K., Bandar, S. A., & Abdi El-Kareem, N. T. (2024). Standard economic study for analyzing the production costs of wheat and yellow corn crops in Iraq for the period (2017-2021). IOP Conference Series: Earth and Environmental Science, 1371(10), 102022. https://doi.org/10.1088/1755-1315/1371/10/102022
Geng, N., Gao, Z., Sun, C., & Wang, M. (2021). How
do farmland rental markets affect farmers’ income? Evidence from a matched
renting-in and renting-out household survey in Northeast China. PLoS ONE,
16(9), e0256590.
https://doi.org/10.1371/journal.pone.0256590
Giwu, O., Mdoda, L., & Ntlanga, S. S. (2024). Assessing the
socio-economic impact of youth engagement in agricultural enterprise for
employment creation and poverty alleviation. Cogent
Social Sciences, 10(1),
2368097.
https://doi.org/10.1080/23311886.2024.2368097
Habtemariam, L. T., Gandorfer, M., Kassa, G. A., & Sieber, S. (2020). Risk experience and smallholder farmers’ climate change adaptation decision. Climate and Development, 12(4), 385–393. https://doi.org/10.1080/17565529.2019.1630351
Hariyanto, W., Suhendrata, T., & Jauhari, S. (2021). Analysis income and household expenses based on livelihood. E3S Web of Conferences, 232, 01005. https://doi.org/10.1051/e3sconf/202123201005
Hasanah, E. N. N., Rahayu, L., & Wijaya, O. (2021). Impact of covid-19 on household food security of red rice farmers dry land in gunungkidul regency. E3S Web of Conferences, 316, 04017. https://doi.org/10.1051/e3sconf/202131604017
Hasibuan, A. M., Gregg, D., & Stringer, R. (2022). Risk preferences,
intra-household dynamics and spatial effects on chemical inputs use: Case of
small-scale citrus farmers in Indonesia. Land Use Policy, 122, 106323.
https://doi.org/10.1016/J.LANDUSEPOL.2022.106323
Ibañez, R. Y., Jr., Velza, J. F. P., Gaylan, R. V., & Catimpuhan, J. M. B. (2024). Income and expenditure analysis of selected lowland rainfed rice farmers in Tubog, Cawayan, Masbate. ASEAN Journal of Scientific and Technological Reports, 27(2), 29–38. https://doi.org/10.55164/ajstr.v27i2.249926
Istiyanti, E., Fairuz Ramli, M.,
& Naufan Firmansyah, M. (2024). Factors affecting the production
risk of organic rice in Kulonprogo Regency, Special Region of Yogyakarta, Indonesia. E3S
Web of Conferences, 595, 01021.
https://doi.org/10.1051/e3sconf/202459501021
Istiyanti, E., Widowati, I., & Al Hasan, T. (2025). Production risk of organic rice due to climate change in Magelang Regency, Central Java, Indonesia. BIO Web of Conferences, 155, 01002. https://doi.org/10.1051/bioconf/202515501002
Jumpah, E. T., Alem, H., Adams, A., Ratinger, T., & Bavorová, M. (2024). Examining the impact of row planting on labor use for sustainable food production among maize farmers in rural Ghana. Agribusiness. https://doi.org/10.1002/agr.22004
Kaur, R., Anupama, Toor, J. S., & Singh, K. (2023). An analysis of consumption expenditure
of non-farm workers by ownership of land.
Journal of Sikh and Punjab Studies, 30(2), 345–363.
https://www.scopus.com/pages/publications/85203803717
Kumar, K. K., & Moharaj, P. (2023). Farm size and productivity relationship among the farming communities in India. Outlook on Agriculture, 52(2), 212–227. https://doi.org/10.1177/00307270231176578
Li, J., Ma, W., Botero-R, J. C., & Quoc Luu, P. (2024).
Mechanization in land preparation and irrigation water productivity: Insights from rice production. International
Journal of Water Resources Development, 40(3), 379–400.
https://doi.org/10.1080/07900627.2023.2197080
Lillo, E. P., Diaz, G. G. G., Diaz, J. L. B., Mago, J. E., & Davirao, C. R. (2025). Socio-demographic profile of food farmers in Carcar City, Cebu, Philippines amid challenges and opportunities for agricultural development. Asian Journal of Agriculture, 9(1), 226–232. https://doi.org/10.13057/ASIANJAGRIC/G090124
List, G., Laszlo, S., & Coomes, O. T. (2020). Mitigating risk for floodplain agriculture in Amazonia: A role for index-based flood insurance. Climate and Development, 12(7), 649–663. https://doi.org/10.1080/17565529.2019.1674125
Liu, L., Ouyang, W., Liu, H., Zhu, J., Fan, X., Zhang, F., Ma, Y.,
Chen, J., Hao, F., & Lian, Z. (2021). Drainage optimization of paddy field
watershed for diffuse phosphorus pollution control and sustainable agricultural
development. Agriculture, Ecosystems and
Environment, 308, 107238. https://doi.org/10.1016/j.agee.2020.107238
Mamadiyarov, D., Dekhkanova, S., Khaitboeva, D., & Uzokova, F. (2023). Improving audition costs of agricultural products under economic modernization. BIO Web of Conferences, 65, 08001. https://doi.org/10.1051/bioconf/20236508001
Maman, U., Razak, Y., Murodi, Saefuddin, A., Hendra, F., Zirmansyah,
Nindyantoro, Ichdayati, L. I., & Junaidi. (2022). Formulating
agricultural extension planning based on farmer achievement: The case
of organic rice farming risk mitigation in Indonesia. Universal
Journal of Agricultural Research, 10(1), 64–76. https://doi.org/10.13189/ujar.2022.100106
Mathinya, V. N., Franke, A. C., Van De Ven, G. W. J., & Giller, K. E.
(2022). Productivity and constraints of small-scale crop farming in the summer
rainfall region of South Africa. Outlook on Agriculture, 51(2),
139–154.
https://doi.org/10.1177/00307270221091839
Mwalyagile, N., Jeckoniah, J. N., & Salanga, R. J. (2024). Gender differences in rice production participation among smallholder farmers in small-scale irrigation schemes in mbarali district, Tanzania. Journal of Agriculture and Food Research, 18, 101390. https://doi.org/10.1016/J.JAFR.2024.101390
Nandy, A., & Singh, P. K. (2020). Farm efficiency estimation using a
hybrid approach of machine-learning and data envelopment analysis:
Evidence from rural eastern India. Journal of Cleaner Production, 267, 122106.
https://doi.org/10.1016/j.jclepro.2020.122106
Nath, A., Bhuyan, P., Gogoi, N., & Deka, P. (2023). Pesticides and chemical fertilizers: Role in soil degradation, groundwater contamination, and human
health. In R. Singh, P. Singh, S. Tripathi, K. K. Chandra, & R. Bhadouria
(Eds.), Xenobiotics in urban ecosystems: Sources, distribution and health impacts (pp. 131–160). Springer Cham.
https://doi.org/10.1007/978-3-031-35775-6_7
Octavio, R. P., Cablinda, R. G., Pagaspas, M. C., & Dumaluan, L. E.
(2024). Agro-economic assessment: Evaluating root
crop-based enterprises in Claveria, Misamis Oriental. International Journal
of Agricultural Technology, 20(2), 651–664.
http://www.ijat-aatsea.com/pdf/v20_n2_2024_March/15_IJAT_20(2)_2024_Octavio,%20R.%20P.--706.pdf
Ojo, O. M., Hubbard, C., Wallace, M., Moxey, A., Patton, M., Harvey, D., Shrestha, S., Feng, S., Scott, C., Philippidis, G., Davis, J., & Liddon, A. (2020). Brexit: Potential impacts on the economic welfare of UK farm households. Regional Studies, 55(9), 1583–1595. https://doi.org/10.1080/00343404.2020.1778164
Oli, D., Gyawali, B., Acharya, S., & Oshikoya, S. (2025). Factors
influencing learning attitude of farmers regarding adoption of farming
technologies in farms of Kentucky, USA. Smart Agricultural Technology, 10, 100801.
https://doi.org/10.1016/J.ATECH.2025.100801
Pratiwi, D., Agustini, S. M. U., Windasari, W., & Kencana, E. N.
(2020). Forecasting farmer exchange rate in Bali Province using Seasonal
Autoregressive Integrated Moving Average (SARIMA) Method. Journal of
Physics: Conference Series, 1503, 012002. https://doi.org/10.1088/1742-6596/1503/1/012002
Prikhodko, I., & Bandurin, M. (2023). Improving the operating conditions of rice irrigation systems as part of
the water management complex of the Lower Kuban. In A. Beskopylny,
M. Shamtsyan, & V. Artiukh (Eds.), XV International scientific
conference “INTERAGROMASH 2022”: Global precision Ag innovation 2022, volume 2 (pp. 665–673). Springer Cham.
https://doi.org/10.1007/978-3-031-21219-2_74
Priyadi, R., Nuryati, R., & Faqihuddin. (2020). The household welfare level of integrated plantation polyculture
farmers. IOP Conference
Series: Earth and Environmental Science, 466,
012004. https://doi.org/10.1088/1755-1315/466/1/012004
Priyana, Y., Fikriyah, V. N., Rudiyanto, Ningsih, R. I. W., & Ramandani, E. F. (2024). Environmental Carrying Capacity assessment for crops in Bengawan Solo watershed, Indonesia: A spatial approach. Journal of Sustainability Science and Management, 19(2), 1–13. https://doi.org/10.46754/jssm.2024.02.001
Punnoli, D., Kunnampalli, J., Punnoli, S., & Selvaraj, S. (2025). Evaluating flood hazard risks using multicriteria analytical hierarchy process and rice farmers’ risk perceptions in Bharathapuzha River Basin, Kerala, South India. Environmental Science and Pollution Research. https://doi.org/10.1007/s11356-025-36389-1
Pusat Data dan Sistem Informasi Pertanian, Sekretariat Jenderal,
Kementerian Pertanian. (2022). Statistik konsumsi pangan tahun 2022
[Statistics of food consumption]. https://satudata.pertanian.go.id/assets/docs/publikasi/Buku_Statistik_Konsumsi_2022.pdf
Qiao, Z., & Liu, S. (2020). Impact of farmer aging on vegetable
production: A case from Yuzhong
county of Gansu province. Journal of
Chinese Agricultural Mechanization, 41(6), 231–236.
https://doi.org/10.13733/J.JCAM.ISSN.2095-5553.2020.06.037
Rahayu, L., Wijaya, O., Syaputra, R., & Robani, A. (2023). Food security and welfare of red rice farmers on dry land in Ponjong District, Gunungkidul Regency. E3S Web of Conferences, 444, 02051. https://doi.org/10.1051/e3sconf/202344402051
Ramadhani, E. E., Sujono, J., & Taryono. (2021). Agriculture land
suitability of tidal swampy area at Palingkau Irrigation Area in Central
Kalimantan Province for national food estate program. IOP Conference Series:
Earth and Environmental Science, 930, 012069. https://doi.org/10.1088/1755-1315/930/1/012069
Ramadhanu, R., Ginting, R., & Ayu, S. F. (2021). Analysis of factors
affecting farmer exchange rate in North Sumatera Province. IOP
Conference Series: Earth and Environmental Science, 782, 022050.
https://doi.org/10.1088/1755-1315/782/2/022050
Rifin, A., Feryanto, & Herawati. (2024). Effect of fertiliser subsidy on fertiliser usage in rice farming in Indonesia. BIO Web of Conferences, 119, 01009. https://doi.org/10.1051/bioconf/202411901009
Rosalia, A. C. T., Suryanto, & Hakim, L. (2021). Spatial analysis of the impact of flood and drought on food security index. Nature Environment and Pollution Technology, 20(2), 721–727. https://doi.org/10.46488/NEPT.2021.v20i02.031
Sampaio, I. S., Machado, C. C., Silva, V. de F., & Zanuncio, J. C. (2021).
Influence of the depreciation method on the wood
transport cost.
Ciência Florestal, 31(1),
145–156. https://doi.org/10.5902/1980509832812
Schroers, J. O., Sauer, N., Krön, K., & Uppenkamp, N. (2020). Fixe und variable Maschinenkosten unter Berücksichtigung eines spezifischen Plan-Restwerts [Fixed and variable machine costs taking into account a specific planned residual value]. Agricultural engineering.Eu, 75(4), 261–269. https://doi.org/10.15150/LT.2020.3250
Sedegah, D. D. (2025). Gender disparities in agricultural land access and
cashew farming participation in Kintampo South District, Ghana.
Journal of Agriculture and Rural Development in the Tropics and Subtropics,
126(1), 129–139.
https://doi.org/10.17170/KOBRA-2025052211168
Shafi, M. M., Habib, R., & Ali, H. (2021). Determinants
of farm households savings in District Kohat, KP, Pakistan. Sarhad Journal of
Agriculture, 38(1), 110–116. https://doi.org/10.17582/journal.sja/2022/38.1.110.116
Sharma, N., & Bhambri, P. (2024). The impact of ICT in agriculture
and rural development. In P.
Bhambri, & I. Paweloszek (Eds.), Digital
sustainability:
Navigating entrepreneurship
in the information
age (pp. 227–240). CRC Press.
https://doi.org/10.1201/9781003484226-15
Slamet Widodo, A., Widodo, Man, N., & Ulum, B. (2024). The influence of welfare level on food security in farmer households. E3S Web of Conferences, 595, 03016. https://doi.org/10.1051/e3sconf/202459503016
Soemitro, R. A. A., Adriati, F., Warnana, D. D., Mukunoki, T., Soetanto, R.,
& Maulana, M. A. (2021). Sediment consolidation in ephemeral river: The effect of applied loading on soil
properties and dredging method selection. International Journal of River
Basin
Management, 19(3), 297–306. https://doi.org/10.1080/15715124.2020.1742135
Stratton, A. E., Kuhl, L., & Blesh, J. (2020). Ecological and nutritional functions of agroecosystems as indicators of smallholder resilience. Frontiers in Sustainable Food Systems, 4, 543914. https://doi.org/10.3389/FSUFS.2020.543914
Sultan, H., Rachmina, D., & Fariyanti, A. (2021). Effect of transaction costs on profit and the capital formation of soybean farming in Lamongan Regency, East Java. AGRARIS: Journal of Agribusiness and Rural Development Research, 7(1), 111–126. https://doi.org/10.18196/agraris.v7i1.4427
Sumaryanto, Susilowati, S. H., Saptana, Ashari, Suryani, E., & Suryadi, M.
(2021). The effects of rural development on main
sources of farm households. IOP Conference Series: Earth and Environmental
Science, 892, 012089.
https://doi.org/10.1088/1755-1315/892/1/012089
Susanawati, Wijaya, O., & Rizqi, M. B. (2022). Local food development strategy in hilly areas of
Gunungkidul Indonesia. IOP Conference
Series: Earth and Environmental Science, 1016, 012026. https://doi.org/10.1088/1755-1315/1016/1/012026
Syaharuddin, Azis, Z., Panggabean, S., Dachi, S. W., Nurhayati, Suwati, Apriyanto, M., & Utami, R. R. (2021). Farmer exchange rate category: A Prediction analysis using ANN back propagation. IOP Conference Series: Earth and Environmental Science, 926, 021002. https://doi.org/10.1088/1755-1315/926/1/012002
To-The, N., Tiet, T., Nguyen-Anh, T., & Nguyen-The, P. (2025). Impact
of human capital and risk preferences on farmers’ decisions towards sustainable
farming practices: A meta-analysis. Journal of Environmental Management,
392, 126752.
https://doi.org/10.1016/J.JENVMAN.2025.126752
Triyono, & Berliani Arifianikmah, A. (2024). Household welfare of rice-fish farmers: An
income-expenditure ratio approach. E3S Web of
Conferences, 595, 01027. https://doi.org/10.1051/e3sconf/202459501027
Vaňová, A. F., Krajčírová, R., Munk, M., Ecková, A., & Bojňanský, J.
(2024). Comparison of essential indicators related to the personal income tax
burden in the EU countries. Potravinarstvo Slovak Journal of Food Sciences,
18, 268–280.
https://doi.org/10.5219/1944
Yanti, D., Berd, I., & Naspendra, Z. (2021). The effect of water-saving irrigation on the growth of local rice plants. IOP Conference Series: Earth and Environmental Science, 922, 012036. https://doi.org/10.1088/1755-1315/922/1/012036