Article
Food Security of Semi-Organic Shallot Farmers in Yogyakarta, Indonesia
Zuhud Rozaki
1,*![]() , Veri Doni Apriyanto 1
, Veri Doni Apriyanto 1![]() , Mohd Fauzi Kamarudin 2
, Mohd Fauzi Kamarudin 2![]() and Nur Rahmawati 1
and Nur Rahmawati 1![]()
1 Department of Agribussines, Universitas Muhammadiyah Yogyakarta, Yogyakarta 55183, Indonesia; veri.doni.fp22@mail.umy.ac.id (V.D.A.); rahma_wati_mf@umy.ac.id (N.R.)
2 Fakulti Pengurusan Teknologi dan Teknousahawanan, Universiti Teknikal Malaysia Melaka, Durian Tunggal 76100, Malaysia; mohdfauzi@utem.edu.my
* Correspondence: zaki@umy.ac.id
|
Citation: Rozaki, Z., Apriyanto, V. D., Kamarudin, M. F., & Rahmawati, N. (2025). Food Security of Semi-Organic Shallot Farmers in Yogyakarta, Received: 8 October 2025 Revised: 7 November 2025 Accepted: 13 November 2025 Published: 1 December 2025
Copyright: © 2025 by the authors. Licensee SCC Press, Kowloon, Hong Kong S.A.R., China. This article is an open access article distributed under the terms and conditions of the Creative Commons Attribution (CC BY) license (https://creativecommons.org/license/by/4.0/). |

Abstract:
Food security is a crucial global issue, especially for farming households that act as both food producers and consumers. The study aims to analyze the level of food security among semi-organic shallot farming households in Yogyakarta and identify the socioeconomic and agronomic factors that influence it. The respondents of this study consisted of 150 semi-organic farming households selected through purposive sampling in Bantul and Kulon Progo Regency of Yogyakarta. Primary data were collected through structured interviews and questionnaires, while secondary data were obtained from the agricultural office and the central statistics agency. Food security was measured using energy and protein adequacy based on the Indonesian Ministry of Health’s Nutritional Adequacy Rate and the Household Food Insecurity Access Scale (HFIAS). The results show that the average energy consumption of households is 1,640.5 kcal/capita/day (80.2% of the recommended dietary allowance), while protein consumption is 50.8 g/capita/day (80.4% of the recommended dietary allowance). Based on the HFIAS, 51.3% of households were in the food-secure category, 32.0% were mildly vulnerable, 16.0% were moderately vulnerable, and 0.7% were highly vulnerable. This study shows that semi-organic farming systems have the potential to support food security. However, their effectiveness is greatly influenced by socioeconomic and institutional factors. These findings provide an empirical basis for formulating policies that encourage sustainable agricultural transition while strengthening the food security of farming households.Keywords:
food security; semi-organic; food recall; energy adequacy; protein adequacy1. Introduction
As an agrarian country, Indonesia has great potential to become a pillar of food security at the regional and global levels, but it still faces various challenges (Gravitiani et al., 2025). Inequalities in food distribution between regions, damage to agricultural ecosystems, and commodity price fluctuations are real obstacles to achieving national food security (Faoziyah et al., 2024). One strategy that is beginning to be developed is the implementation of a semi-organic farming system that combines chemical and organic inputs. This system has the potential to improve environmental quality, reduce dependence on synthetic chemical inputs, and produce healthier products with high market value (Gamage et al., 2023). Yogyakarta, with its diverse agroecology and progressive local policies, is a suitable area for developing semi-organic farming, especially for shallots.
Conventional shallot cultivation systems rely on chemical fertilizers and pesticides, which result in high production costs and soil degradation. Semi-organic cultivation systems have emerged to address these issues by combining organic and conventional practices to reduce dependence on synthetic inputs while maintaining productivity. As a result, farmers achieve good income stability, strengthening their ability to access sufficient and diverse food for household needs (Munezero et al., 2023).
In addition to being a basic ingredient in Indonesian cuisine, shallots also have export potential and can provide a stable income for farmers (Rahmawati et al., 2023). Several regions in Yogyakarta, such as Bantul and Kulon Progo Regencies, have developed semi-organic shallot cultivation that is increasingly concerned with environmental sustainability (Triharyanto et al., 2022). However, despite the great opportunities, many farmers still face various obstacles, ranging from limited access to natural inputs, market price fluctuations, to limited markets for semi-organic products. This raises an important question about the extent to which the semi-organic system can actually strengthen farmers’ food security (Imran et al., 2025).
Household food security for farmers is not only influenced by land productivity, but also by the household’s ability to access, utilize, and maintain food sustainably (Janni et al., 2023). According to the Food and Agriculture Organization (FAO), food security is built on four main pillars, namely availability, access, utilization, and stability of food. It is supported by broad dimensions such as nutrition, health, and policy institutions that guarantee sustainable access to food for all parties (Thamaga-Chitja et al., 2025). In practice, farmers are often still vulnerable, especially when facing lean seasons, crop failures, or market fluctuations (Hlatshwayo et al., 2023). Policy support and involvement in farmer groups are important factors in building farmers' resilience to these risks (Singh et al., 2023). Therefore, a comprehensive understanding of the factors that determine food security needs to be the basis for developing targeted interventions.
This study was conducted to determine the level of food security among households of semi-organic shallot farmers in Yogyakarta, particularly in Bantul and Kulon Progo Regencies. This study also aims to identify socioeconomic and technical cultivation factors that affect farmers’ food security, such as income, land area, farming experience, and nutritional consumption. A quantitative approach was used to provide an objective picture that can be scientifically tested and is relevant as a basis for policy (Susanawati & Noviyanti, 2024). The findings of this study are expected to contribute scientifically to the development of literature on food security and semi-organic agriculture (Geppert et al., 2024). Thus, the semi-organic agricultural system is not only an alternative production model but also capable of improving food security and farmer welfare in a sustainable manner (Rahayu et al., 2024).
This study examines food security from a household perspective, focusing on access, availability, and utilization of food in farming families. Although shallots are not a staple food, income from agricultural businesses plays an important role in supporting household purchasing power and access to food. Therefore, food security among semi-organic shallot farmers provides insight into alternative agricultural models that can strengthen household resilience in rural areas.
2. Materials and Methods
2.1. Research Location
This study was conducted in two regencies in Yogyakarta, namely Bantul and Kulon Progo. Both areas are known as centers of semi-organic shallot production. In addition, these locations were chosen because they have consistently implemented semi-organic cultivation practices. Therefore, these areas also have relatively similar agroecological conditions and play an important role in the regional supply of shallots.
The Imogiri subdistrict has approximately 125 hectares of shallot fields with a harvest productivity of up to 20 tons/ha. In Kulon Progo Regency, specifically in Srikayangan Subdistrict, the area of shallot fields is 300 hectares with a productivity of up to 16 tons/ha. Therefore, these two regencies are the main centers of shallot production in Yogyakarta and have relevant characteristics for the study of semi-organic shallot farmers.
2.2. Sampling Procedure
The target population of this study was semi-organic shallot farmers located in Bantul and Kulon Progo Regencies, Yogyakarta. The sample frame was obtained from the Agriculture Office in both regencies, which recorded active semi-organic shallot farmers. This study used purposive sampling because the number of organic farmers is relatively limited and specific. Respondents were selected based on the following criteria: (1) residing in Kulon Progo and Bantul, (2) planting semi-organic shallots for at least the last two planting seasons, and (3) willing to be interviewed. A total of 150 respondents, consisting of 75 people in Srikayangan, Kulon Progo Regency, and 75 people in Imogiri, Bantul Regency, were involved in this study, representing 100% of semi-organic farmers who met the criteria. The non-response rate was 0% because all respondents were willing and participate. Missing data were checked before analysis, and no significant values were found, so the listwise deletion method was not necessary. This selection process ensured that the sample represented the socioeconomic and agronomic conditions of semi-organic shallot farmers in the study location.
Table 1. Location and Number of Respondents.
|
Research Location |
Number of Respondents |
|
Srikayangan, Kulon Progo |
75 |
|
Imogiri, Bantul |
75 |
|
Total |
150 |
2.3. Data Collection Procedures
This study used primary data as its main source of information collection. Primary data are data obtained directly from respondents in the field through direct interactions such as interviews and questionnaires. The structured questionnaire used in this study consisted of three main sections designed to capture complementary data on household conditions, food security, and nutritional adequacy (see Table 2).
Table 2. Structure and Main Contents of the Questionnaire.
|
Section |
Variables Collected |
Purpose |
|
Demographic and Socioeconomic Profile |
Age, gender, education, number of family members, household income, land area, farming experience |
To describe the demographic and economic background of farming households |
|
Household Food Insecurity Access Scale (HFIAS) |
Nine standard questions on food access, anxiety, and adequacy |
To categorize household food security levels |
|
Two 24-hour Food Recalls |
Types and quantities of foods and beverages consumed, portion size, and meal frequency |
To estimate household energy and protein adequacy based on the Indonesian |
Detailed questionnaire items, including the demographic and socioeconomic profile of respondents (Table A1), the full HFIAS (Table A2), and 24-hour food recall forms (Table A3), are presented in Appendix A.
The use of primary data allows researchers to obtain more accurate, up-to-date information that is relevant to the actual conditions experienced by respondents. This primary data was collected to describe food security conditions of semi-organic shallot farming households in a factual and contextual manner. The questionnaire was designed to collect socioeconomic and demographic characteristics of semi-organic shallot farming households, including age, education level, number of family members, land area, farming experience, and household income. Data collection was conducted through direct interviews accompanied by field observations to ensure data accuracy and relevance. One section of the questionnaire uses the Household Food Insecurity Access Scale (HFIAS) instrument developed by the FANTA project to measure household food security levels. This instrument was translated into Indonesian by a team of researchers and then back into English to ensure consistency in meaning and terminology. This ensures that the questions are easily understood by respondents and relevant to conditions in the field. In addition, two 24-hour food recalls were conducted with respondents through direct interviews using a multiple-pass approach. This method covers all food and beverages consumed the previous day, including the frequency of meals and the types of side dishes consumed. The 24-hour food recall questions were integrated into the questionnaire to record all foods and beverages consumed by each respondent during the previous day. To ensure robustness, the recall was conducted twice on non-consecutive days to capture daily variations in food intake. The multiple-pass method was applied to minimize recall bias, and the results were cross-checked with household meal patterns and portion size references to improve accuracy. This method follows standard nutritional survey protocols recommended by FAO and FANTA, ensuring its scientific validity for assessing dietary adequacy. Meanwhile, secondary data are supporting data obtained from various previously available sources, such as official publications, statistical reports, government documents, scientific journals, and relevant previous research results. Data collection was conducted in May 2025 during the dry season.
Food security measurement using the two 24-hour food recall method and the Household Food Insecurity Access Scale (HFIAS). This method is used to analyze food intake, food access uncertainty, and experiences of hunger. Table 3 presents the main indicators used to analyze food security in this study.
Table 3. Food Security Indicators.
|
Food Recall |
HFIAS |
|
Types of food consumed in the last 2x24 hours, frequency of consumption of energy sources (kcal/person/day), protein (g/person/day), vitamins, and minerals, total energy intake, and nutrient intake per individual |
Uncertainty of food access, decline in food quality and diversity, decline in food consumption, acute hunger, and frequency of incidents. |
2.4. Analysis Techniques
Food security of semi-organic shallot farmers was analyzed using two analysis techniques, namely:
2.4.1. Food Recall
In this analysis technique, respondents were asked to mention the types and amounts of food they consumed in the last two 24-hour food recalls. Data from two 24-hour food recalls were averaged for each household to obtain a more reliable estimate of daily energy and nutrient intake. This approach helps reduce variation in consumption between days and improves the accuracy of dietary assessment. The data was then analyzed using the Nutrisurvey application to determine the Estimated Energy Requirements and Protein Requirements.
2.4.2. Household Food Insecurity Access Scale
The household food insecurity access scale analysis method uses nine questions, as follows: (Q1) Are you worried about not having enough food for your family? (Q2) Does your family have to eat less frequently during the day due to insufficient food? (Q3) Is there no food of any kind due to a lack of resources to obtain food? (Q4) Does the family have to consume food they dislike due to a lack of food they like? (Q5) Does the family have to eat smaller portions due to insufficient food? (Q6) Does the family have to eat less frequently during the day due to insufficient food? (Q7) Is there no food of any kind due to a lack of resources to obtain food? (Q8) Has the family ever gone to bed hungry due to not having enough food? (Q9) Has the family ever gone without eating for a day due to a lack of food? (Derso et al., 2021).
If respondents answer each question with a score of 0–3. A score of 0 indicates never, one indicates rarely (1–2 times in 4 weeks), and two indicates occasionally (3–10 times in 4 weeks). In this method, food security is categorized into four levels (see Table 4).
Table 4. Food Security Categories
|
|
Level of Food Security |
Total Score Ranking |
|
1 |
Food Safety |
0–1 |
|
2 |
Severe Food Insecurity |
2–7 |
|
3 |
Quite Food Insecure |
8–14 |
|
4 |
Highly Food Insecure |
15–27 |
2.4.3. Multivariate Regression Analysis
The data analysis in this study consisted of both descriptive and inferential analyses. Descriptive analysis was used to describe the food security condition of semi-organic shallot farming households based on the Household Food Insecurity Access Scale (HFIAS) and the levels of household energy and protein adequacy.
Furthermore, to examine the socioeconomic factors influencing the levels of energy and protein adequacy, a multivariate regression analysis was conducted using the multiple linear regression approach. The dependent variables in this model were the levels of energy and protein adequacy, while the independent variables included age, gender, education level, household size, land area, and farming experience. This analysis was employed to determine the extent to which household socioeconomic characteristics affect food security from a nutritional perspective. All statistical analyses were carried out using IBM SPSS Statistics, with a significance level of 5% (α = 0.05).
3. Results
3.1. Respondent Characteristics
The characteristics of respondents in this study included the age of farmers, gender, education level, number of family members, farming experience, experience in semi-organic shallot farming, land area, and land ownership status (Hlatshwayo et al., 2023; Table 5). These characteristics can affect semi-organic shallot production and the level of production factor efficiency (Rajabzadeh-Dehkordi et al., 2023).
Table 5. Characteristics of Semi-Organic Shallot Farmer Respondents.
|
|
Frequency |
Percentage |
|
Frequency |
Percentage |
|
Age |
|
|
Land ownership |
|
|
|
28–40 |
33 |
22.0 |
Own |
121 |
80.7 |
|
41–60 |
88 |
58.7 |
Rent |
19 |
12.7 |
|
61–78 |
29 |
19.3 |
Profit Sharing |
10 |
6.7 |
|
|
150 |
100.0 |
|
150 |
100.0 |
|
Gender |
|
|
Land area (Ha) |
|
|
|
Male |
113 |
75.3 |
< 0.5 |
6 |
4.0 |
|
Female |
37 |
24.7 |
0.5–1.5 |
144 |
96.0 |
|
|
150 |
100.0 |
|
150 |
100.0 |
|
Education |
|
|
CRF experience (years) |
|
|
|
Uneducated |
0 |
0.0 |
1–10 |
42 |
28.0 |
|
Elementary School |
56 |
37.3 |
11–20 |
45 |
30.0 |
|
SMP |
29 |
19.3 |
21–30 |
23 |
15.3 |
|
SMA |
54 |
36.0 |
31–40 |
23 |
15.3 |
|
Higher Education Institution |
11 |
7.3 |
> 40 |
17 |
11.3 |
|
|
150 |
100.0 |
|
150 |
100.0 |
|
Family Members |
|
|
SORF experience (years) |
|
|
|
< 3 |
40 |
26.7 |
1–10 |
49 |
32.7 |
|
3–6 |
108 |
72 |
11–20 |
63 |
42.0 |
|
> 6 |
2 |
1.3 |
21–30 |
38 |
25.3 |
|
|
150 |
100.0 |
|
150 |
100.0 |
3.1.1. Age
Age is a demographic variable that indicates how long a person has lived from birth to a certain point in time (Wijerathna-Yapa & Pathirana, 2022). Age can also influence how individuals adopt innovations, consumption patterns, and approaches to agriculture or business (Muis et al., 2025). Based on the data obtained, the majority of respondents were in the 41–60 age group, totaling 88 people (58.7%). There were 33 respondents (22.0%) aged 28–40 years, while 29 respondents (19.3%) were aged 61–78 years. These results indicate that most of the farmers who participated in the survey were of productive and experienced age, generally at the peak of their physical and mental abilities for agricultural activities.
3.1.2. Gender
Gender is a demographic variable that indicates the biological division between males and females (Chiemela et al., 2022). In agriculture, gender differences still greatly influence the work structure and division of labor in households and farming businesses (Wardani et al., 2023). The data shows that most respondents were male, namely 113 people (75.3%), while only 37 people (24.7%) were female. This reflects that agricultural activities in the research location are still dominated by men. However, the significant participation of women also shows that women play an active role in supporting the sustainability of family farming businesses.
3.1.3. Education
Education is a learning process that provides individuals with knowledge, skills, values, and attitudes to develop their potential (Samim et al., 2021). Farmers with higher levels of education generally have better skills in planning, calculating risks, and adopting innovations (Mazenda, 2021). Most respondents in this study had a formal education level of elementary school (SD) with 56 people (37.3%), followed by respondents with a high school education (SMA) with 54 people (36.0%), and junior high school (SMP) with 29 people (19.3%). Meanwhile, only 11 respondents (7.3%) had attended college, and none of the respondents were completely uneducated (0%). These findings indicate that the majority of farmers have a basic to secondary education.
3.1.4. Household Members
Household members are individuals who live together in one residence or dwelling and usually consume food from the same kitchen, and are under the same economic management (Yeleliere et al., 2022). The ideal number of household members can support labor efficiency in agricultural businesses, while too few or too many members can affect productivity and family welfare (Clapp et al., 2022). Based on the results of the study, the majority of respondents had between 3 and 6 household members, namely 108 people (72.0%). A total of 40 respondents (26.7%) had households with fewer than 3 members, and only 2 respondents (1.3%) had households with more than 6 members. This shows that the family structure of farmers is dominated by nuclear families or small-to-medium families.
3.1.5. Land Ownership
Land ownership is the legal status or control of a person over a plot of land that he or she uses, whether for agriculture, settlement, or other economic activities (Muluneh, 2021). Private ownership generally provides farmers with a sense of security in managing their land, unlike leasehold or sharecropping arrangements, which impose certain limitations on decision-making and agricultural development (Wudil et al., 2022). The tabulation results show that most respondents own their own land, namely 121 people (80.7%). The rest access land through a rental system, namely 19 people (12.7%), and through profit sharing, namely 10 people (6.7%). This indicates that most farmers in this study have a high level of agrarian independence.
3.1.6. Agricultural Land Area
Land area is a physical measure of agricultural land owned or managed by farmers, usually expressed in hectares (Ha; Akbar et al., 2024). Land area is an important indicator in determining the scale of farming, production potential, labor intensity, and efficiency of agricultural input use (Kavanagh et al., 2021). Based on the results of the study, most respondents had a land area of between 0.5 and 1.5 hectares, namely 144 people (96.0%). Only 6 people (4.0%) had land with an area of less than 0.5 hectares, and no respondents had land larger than 1.5 hectares. This shows that the majority of farmers in this study are in the small to medium farmer category, with land that is still relatively small.
3.1.7. Farming Experience
Experience in crop rotation farming (CRF) refers to the length of time farmers apply a system of rotating crop types on the same land from year to year (Mohd Tohit et al., 2025). This system aims to maintain soil fertility, reduce the risk of pests and diseases, and increase agricultural yields in a sustainable manner (Omer et al., 2024). From Table 5, 45 respondents (30.0%) had 11–20 years of experience in CRF. This was followed by 42 respondents (28.0%) with 1–10 years of experience, then 23 respondents (15.3%) with 21–30 years of experience, and 23 respondents (15.3%) with 31–40 years of experience. The remaining 17 respondents (11.3%) had more than 40 years of experience.
3.1.8. Experience in Semi-Organic Farming
Farming experience in the Semi-Organic Resource Farming (SORF) system refers to the length of time farmers have been implementing semi-organic farming practices, which is an agricultural system that combines the use of organic inputs (such as manure, compost, and botanical pesticides) with limited and controlled use of inorganic inputs (Saidah et al., 2024). This system is generally implemented by farmers as a transition to fully organic farming, or as a compromise between production needs and efforts to maintain ecosystem sustainability (Jeevitha et al., 2024). Based on the data, SORF farming experience is grouped into five time categories. A total of 45 respondents (30.0%) had 11–20 years of experience, which was the largest group. This was followed by 42 respondents (28.0%) who had 1–10 years of experience, indicating that quite a number of farmers had just started this system. Meanwhile, 23 respondents (15.3%) each had 21–30 years and 31–40 years of experience, and 17 respondents (11.3%) had more than 40 years of experience in the semi-organic system.
3.2. Food Recall
The measurements in this study consisted of two main aspects, namely energy intake and protein intake (Marwanti et al., 2024). Each person’s energy consumption was calculated based on the calories they ate and drank every day (Kusumawardani et al., 2021). Meanwhile, protein consumption was measured by calculating the number of grams of protein contained in the food consumed by each person per day. Every type of food and beverage consumed by household members was recorded in detail, then converted into energy and protein content based on the nutritional composition of food according to Indonesian Minister of Health Regulation No. 28 of 2019 (2019). The Adequate Energy Intake (AEI) is the average daily energy requirement (kcal) to maintain health, body weight, and physical activity, while the Adequate Protein Intake (API) is the daily protein requirement (grams) to support growth and tissue repair. Nutritional adequacy is calculated using the following formula:
![]() (1)
(1)
![]() (2)
(2)
NutriSurvey 2007 software was used to process food consumption data collected through the two 24-hour food recall methods. Each type of food and beverage consumed by respondents is entered into the NutriSurvey software to determine its energy and protein content. NutriSurvey automatically converts food consumption data into quantitative nutrient intake values, including total energy (kcal), protein (g), fat (g), and carbohydrates (g), based on portion size and frequency of consumption.
A statistical description of the food intake data was conducted to provide an overview of respondents’ nutrient and energy consumption. Descriptive statistics, including mean, standard deviation (SD), minimum, and maximum values, were calculated for total energy, protein, fat, and carbohydrate intake. These basic data were used to assess the overall variability and representativeness of the sample.
The conversion of food consumption into nutrient and energy values was based on the Indonesian Food Composition Table (Direktorat Gizi Masyarakat, 2019). Each food item was converted according to standardized nutrient conversion factors: carbohydrates = 4 kcal/g, proteins = 4 kcal/g, and fats = 9 kcal/g (FAO, 2003). These conversion factors were automatically applied within the NutriSurvey 2007 software to ensure consistency and accuracy in nutrient and energy estimation.
Data on energy and macronutrient adequacy (protein, fat, and carbohydrates) were obtained using the two 24-hour food recall method. The results were then categorized based on the nutritional adequacy criteria issued by the Indonesian Ministry of Health (2019). The categories for energy adequacy were: severely deficient (< 60%), deficient (60%–69%), adequate (70%–79%), good (80%–119%), and excessive (≥ 120%). The categories for protein, fat, and carbohydrate adequacy are: very low (< 70%), low (70%–79%), adequate (80%–89%), good (90%–119%), and high (≥ 120%).
Based on Table 6, the average energy and protein adequacy of semi-organic shallot farming households is presented in the form of mean ± standard deviation (SD) to provide clearer results. The average daily energy intake per capita is 1,640.5 ± 82.3 kcal, while the recommended nutritional adequacy rate is 2,044.7 kcal per capita per day. This shows that the energy adequacy level of these farming households is only about 80.2% of the recommended requirement. Meanwhile, for protein intake, the average consumption per capita per day is 50.8 ± 6.7 grams, from an NR of 63.2 grams, so that the protein adequacy level reaches 80.4%. These two data points show that semi-organic shallot farming households are still below the ideal standard (100%) for nutritional adequacy. Although energy and protein adequacy levels are close to optimal, efforts are still needed to improve access to and consumption of nutritious foods so that daily energy and protein requirements can be optimally met. This condition can also be an indicator of potential nutritional vulnerability in farming households, especially if there are fluctuations in shallot prices or production that affect purchasing power and consumption patterns.
Table 6. Average Energy and Protein Adequacy (Mean ± SD) and Nutrient Adequacy Level of Semi-Organic Shallot Farmers.
|
Nutritional Content |
Intake |
Recommended Dietary Allowance (RDA) |
Nutritional |
|
Energy (kcal/person/day) |
1640.5 ± 82.3 |
2044.7 |
80.2 |
|
Protein (g/person/day) |
50.8 ± 6.7 |
63.2 |
80.4 |
3.3. Household Food Insecurity Access Scale (HFIAS)
The Household Food Insecurity Access Scale (HFIAS) is a quantitative instrument used to measure the level of household food insecurity based on their perceptions and experiences in accessing food during the last 30 days (Triyono et al., 2025). This scale was developed by Food and Nutrition Technical Assistance (FANTA) and consists of nine questions that reflect three main aspects, namely concerns about food availability, decline in food quality, and reduction in consumption due to resource constraints (Angeles-Agdeppa et al., 2021). According to Coates et al. (2007), the HFIAS has proven to be effective because it captures the subjective dimensions of food insecurity that are not always reflected in quantitative data alone, such as production or income.
Based on the survey results (see Table 7), it is known that most semi-organic shallot farming households do not experience severe food insecurity. This can be seen from 84.0% of respondents who are not worried about food availability (Q1), and only 16.0% who rarely experience it. When asked about not being able to eat their preferred foods (Q2), 64.0% of households did not experience this, but 36.0% admitted to having experienced it, with 33.3% rarely and 2.7% occasionally. A total of 66.7% of households did not eat only certain types of food (Q3), but 33.3% experienced limited food variety, consisting of 15.3% rarely, 14.7% sometimes, and 3.3% often. Furthermore, 85.3% of respondents never had to eat food they did not like (Q4), while 14.7% rarely experienced this.
Table 7. Results of the HFIAS Questionnaire for Semi-Organic Red Shallot.
|
Nomor |
Variabel |
No |
Yes |
Total |
|||||||
|
Rarely (1 – 2x) |
Sometimes (3 – 10x) |
Often (> 10x) |
|||||||||
|
n |
% |
n |
% |
n |
% |
n |
% |
n |
% |
||
|
1 |
Concerned about food (Q1) |
126 |
84.0 |
24 |
16.0 |
0 |
0.0 |
0 |
0.0 |
24 |
16.0 |
|
2 |
Unable to eat preferred foods (Q2) |
96 |
64.0 |
50 |
33.3 |
4 |
2.7 |
0 |
0.0 |
54 |
36.0 |
|
3 |
Only eating certain types of food (Q3) |
100 |
66.7 |
23 |
15.3 |
22 |
14.7 |
5 |
3.3 |
50 |
33.3 |
|
4 |
Eating food you don’t like (Q4) |
128 |
85.3 |
22 |
14.7 |
0 |
0 |
0 |
0 |
22 |
14.7 |
|
5 |
Eat smaller portions (Q5) |
118 |
78.7 |
32 |
21.3 |
0 |
0 |
0 |
0 |
32 |
21.3 |
|
6 |
Reducing the amount of food per day (Q6) |
129 |
86 |
21 |
14 |
0 |
0 |
0 |
0 |
21 |
14 |
|
7 |
There is no food at all in the household (Q7) |
148 |
98.7 |
2 |
1.3 |
0 |
0 |
0 |
0 |
2 |
1.3 |
|
8 |
Going to bed hungry (Q8) |
150 |
100 |
0 |
0 |
0 |
0 |
0 |
0 |
0 |
0 |
|
9 |
A whole day without eating (Q9) |
150 |
100.0 |
0 |
0.0 |
0 |
0.0 |
0 |
0.0 |
0 |
0.0 |
Most households (78.7%) also did not experience a reduction in meal portions (Q5), but 21.3% admitted to eating smaller portions. A reduction in the number of meals per day (Q6) was not experienced by 86.0% of respondents, but 14.0% rarely experienced it. Extreme situations such as having no food at home (Q7), going to bed hungry (Q8), and not eating for a whole day (Q9) were almost non-existent; 98.7% never ran out of food, and 100% never went to bed hungry or went without eating for a whole day.
Based on Table 8 regarding the food security status of farming households in organic farming systems, it is known that the majority of households, namely 77 households (51.3%), are in the food security category, which means they have sufficient access to nutritious and sustainable food. However, there are still 48 households (32.0%) classified as mildly food insecure, meaning that they are beginning to experience limited access to food, although not yet at an alarming level. Furthermore, 24 households (16.0%) fall into the moderately food insecure category, indicating more serious problems related to the inability to meet food needs, both in terms of quantity and quality. In fact, there is one household (0.7%) classified as highly food insecure, indicating a very alarming condition where these households are likely to experience extreme hunger or food shortages.
Table 8. Food Security Status of Farmer Households in Organic Farming.
|
|
Food Security Status |
Households |
Percentage (%) |
|
1 |
Food Security |
77 |
51.3 |
|
2 |
Slightly Vulnerable to Food Insecurity |
48 |
32.0 |
|
3 |
Moderately Vulnerable to Food Insecurity |
24 |
16.0 |
|
4 |
Highly Vulnerable to Food Insecurity |
1 |
0.7 |
|
|
Total |
150 |
100.0 |
Overall, these data indicate that although most organic farming households are food secure, there is still a significant proportion of households experiencing varying degrees of food insecurity. Therefore, sustained attention and policy interventions are needed to strengthen the food security system, especially for households that are still classified as vulnerable, in order to ensure equitable and sustainable access to food for all organic farmers.
Although most semi-organic shallot farming households are considered food secure 51.3%, clear differences in food security levels are still evident among respondents. Farmers with small plots of land and unstable incomes tend to have lower levels of food security due to limited production capacity and purchasing power. Therefore, socioeconomic diversity among semi-organic farmers plays an important role in determining household food security levels.
3.4. Multivariate Regression Analysis Results
A multivariate regression analysis was conducted to examine the influence of socioeconomic characteristics on the level of energy and protein adequacy among semi-organic shallot farming households in Yogyakarta. The results of the linear regression analysis show that the energy adequacy model has an R² value of 0.147, indicating that approximately 14.7% of the variation in energy adequacy can be explained by socioeconomic variables such as age, gender, education, land area, and household size. The model is statistically significant (F = 2.677; p = 0.007), suggesting that these variables collectively affect the level of household energy adequacy.
Individually, age (p = 0.046) and gender (p = 0.001) have a significant effect on energy adequacy. The results indicate that households headed by males tend to have higher energy adequacy levels compared to those headed by females. Meanwhile, as the age of the household head increases, the level of energy adequacy tends to decrease, which may be attributed to lower productivity and reduced economic activity at older ages. For the protein adequacy model, the R² value is 0.106, meaning that 10.6% of the variation in protein adequacy is explained by the socioeconomic variables examined. Although the model is only marginally significant (F = 1.837; p = 0.067), the partial analysis shows that gender (p = 0.005) significantly affects protein adequacy, while household size (p = 0.058) and age (p = 0.087) show a near-significant influence. These findings suggest that households headed by males have higher protein adequacy levels than those headed by females.
Overall, the results indicate that demographic factors such as gender and age of the household head play an important role in determining the level of energy and protein adequacy. Other socioeconomic factors, such as education, land area, and household size, do not show a significant effect but still contribute to the variation in household nutritional adequacy. These findings emphasize that food security is multidimensional, where social, economic, and production capacities collectively determine the household’s ability to meet its daily nutritional needs.
To further illustrate this relationship, a scatter plot with a Loess fit curve was developed (Figure 1). The plot demonstrates a positive but nonlinear relationship, indicating that households with larger cultivated areas tend to have higher energy intake levels. This suggests that increasing land ownership or access to larger cultivated areas can enhance household food availability and nutritional intake. However, the curve also shows that the effect of land expansion tends to stabilize after a certain threshold, implying that other factors such as income management, household size, and food expenditure patterns may moderate this relationship.
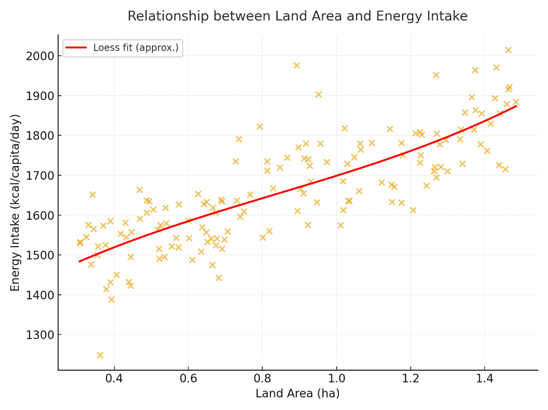
Figure 1. Scatter plot showing the relationship between land area and household energy intake with a Loess fit curve.
4. Discussion
This study shows that the energy and protein consumption levels of semi-organic shallot farming households in Yogyakarta only reach around 80% of the Recommended Dietary Allowance (RDA). These findings reveal limitations in achieving household nutrition despite farmers being directly involved in food production. These results are in line with the initial hypothesis of the study, which suggested that the semi-organic system does not fully guarantee the food security of farming households. Thus, these findings emphasize that food security must be understood multidimensionally, encompassing not only production aspects, but also access, distribution, and household consumption capacity.
In addition, socioeconomic characteristics such as age, education level, number of family members, land area, farming experience, and household income play an important role in explaining variations in energy and protein adequacy among semi-organic shallot farming households. Thus, households with smaller land areas, more family members, and unstable incomes tend to have lower levels of nutritional adequacy. This indicates that factors such as household production capacity and purchasing power also influence their ability to meet their daily food needs. This relationship confirms that food security outcomes are determined not only by agricultural productivity but also by socioeconomic resilience at the household level.
Compared to previous research by Sudomo (2023), which stated that agroforestry in Indonesia can indeed contribute to the food security of smallholder farmers through food diversification and increased income, its contribution to nutritional adequacy is still limited. Research by Duffy et al. (2021) also shows that traditional agroforestry systems, such as home gardens, are more effective in increasing food consumption variety than commercial systems that are more oriented towards cash income. Thus, this study expands the empirical evidence by showing that semi-organic systems, although potentially productive, still face limitations in ensuring food security for shallot farmer households.
Theoretically, this study enriches the study of household food security by emphasizing that the success of semi-organic farming cannot be assessed solely from an ecological perspective, but also from socio-economic indicators. Practically, the results of this study emphasize the need for policies that support farmers’ access to stable markets, nutrition education, and food diversification programs to increase household consumption. Such institutional support will greatly determine the effectiveness of semi-organic systems in strengthening the food security of smallholder farmers. To make these recommendations more applicable in practice, nutrition education can be integrated into existing agricultural extension activities and farmer group discussions. These programs should focus on increasing farmers’ awareness of balanced diets, household food planning, and the use of their own agricultural products for daily consumption. Furthermore, food diversification can be encouraged by promoting the cultivation of complementary crops such as vegetables, legumes, and local tubers alongside shallots. This effort is expected to improve household nutrition while at the same time reducing dependence on a single commodity and supporting more stable farmer incomes. From a policy perspective, the results of this study convey the message that the transformation towards sustainable agriculture needs to be accompanied by inclusive socio-economic interventions in order to address the food insecurity that still exists at the household level.
Although this study provides significant empirical contributions, there are several limitations that need to be considered. This study does not assess seasonal factors that may affect energy and protein consumption, nor does it explore aspects of food preferences and household spending patterns in detail. Future research could integrate longitudinal analysis to examine food security dynamics throughout the production cycle, as well as add social and environmental sustainability indicators. In addition, new trends such as the digitization of agricultural markets and the role of local communities in strengthening food chains could be interesting focuses for further study. These findings show that semi-organic farming systems can indirectly ensure household food security by increasing income stability, reducing input costs, and promoting sustainable agricultural practices that support long-term livelihood security.
5. Conclusions
This study shows that most semi-organic shallot farming households in Yogyakarta are food secure, as indicated by energy and protein adequacy that is close to the standard, as well as a low frequency of extreme food insecurity. HFIAS measurements show that 51.3% of households are in the food security category, while the rest are still in the mild food insecurity (26.7%), moderate food insecurity (20.7%), and severe food insecurity (1.3%) categories. This shows that although the majority are relatively secure, food security is not yet fully equitable among semi-organic farmers. Socioeconomic factors that affect food security include the productive age of farmers, the dominance of males in farming activities, a majority of low to medium education levels, high land ownership (80.7%), and considerable farming experience, both in rotation and semi-organic systems. The average energy intake of 1,640.5 kcal/capita/day and protein intake of 50.8 g/capita/day, which is equivalent to 80% of the requirement, indicates a potential for malnutrition that must be watched out for.
CRediT Author Statement: Zuhud Rozaki: Conceptualization, Data curation, and Writing – original draft; Veri Doni Apriyanto: Data curation and Writing – original draft; Mohd Fauzi Kamarudin: Conceptualization; Nur Rahmawati: Conceptualization.
Data Availability Statement: The data underlying this study are not publicly available, but are available from the corresponding author upon reasonable request.
Funding: This research was funded by Universitas Muhammadiyah Yogyakarta.
Conflicts of Interest: The authors declare no conflict of interest.
Informed Consent Statement: Informed consent was obtained from all subjects involved in the study.
Acknowledgement: The authors thank Universitas Muhammadiyah Yogyakarta for funding this research. The authors would also like to acknowledge the Center for Technopreneurship Development (CTeD), and the Fakulti Pengurusan Teknologi dan Teknousahawanan, Universiti Teknikal Malaysia Melaka.
Abbreviations
The following abbreviations are used in this manuscript:
|
HFIAS |
Household Food Insecurity Access Scale |
|
FAO |
Food and Agriculture Organization |
|
RDA |
Recommended Dietary Allowance |
|
FANTA |
Food and Nutrition Technical Assistance |
|
CRF |
Crop Rotation Farming |
|
SORF |
Semi-Organic Resource Farming |
|
SPSS |
Statistical Package for the Social Sciences |
|
IDR |
Indonesian Rupiah |
Table A1. Demographic and Socioeconomic Profile of Respondents.
|
No |
Question Item |
Response Type |
|
1 |
Name |
Open-ended |
|
2 |
Phone Number |
Numeric (contact) |
|
3 |
Age |
Years |
|
4 |
Address |
Open-ended |
|
5 |
Gender |
[ ] Male [ ] Female |
|
6 |
Education (years and highest certificate obtained) |
[ ] No schooling [ ] Elementary [ ] Junior High [ ] Senior High [ ] Diploma [ ] Bachelor |
|
7 |
Role in Household |
[ ] Father [ ] Mother [ ] Child [ ] Other |
|
8 |
Number of Family Members (and number working as farmers) |
Persons |
|
9 |
Secondary Occupation |
[ ] Yes [ ] No |
|
10 |
Average Monthly Income from Farming |
IDR / month |
|
11 |
Average Monthly Non-farming Income |
IDR / month |
|
12 |
Savings |
IDR |
|
13 |
Assets (estimated value) |
IDR |
|
14 |
Monthly Household Expenditure |
IDR / month |
|
15 |
Farming Experience |
Years |
Table A2. Household Food Insecurity Access Scale (HFIAS)
|
Code |
Question (Past Four Weeks) |
Response Type |
|
Q1 |
Did you worry that your household would not have enough food? |
Yes/No → Frequency: rarely/sometimes/often |
|
Q2 |
Were you or any household member not able to eat the kinds of foods you preferred because of a lack of resources? |
Yes/No → Frequency: rarely/sometimes/often |
|
Q3 |
Did you or any household member have to eat a limited variety of foods due to a lack of resources? |
Yes/No → Frequency: rarely/sometimes/often |
|
Q4 |
Did you or any household member have to eat some foods that you really did not want to eat because of a lack of resources? |
Yes/No → Frequency: rarely/sometimes/often |
|
Q5 |
Did you or any household member eat a smaller meal than needed because there was not enough food? |
Yes/No → Frequency: rarely/sometimes/often |
|
Q6 |
Did you or any household member eat fewer meals in a day because there was not enough food? |
Yes/No → Frequency: rarely/sometimes/often |
|
Q7 |
Was there ever no food at all in your household because of lack of resources? |
Yes/No → Frequency: rarely/sometimes/often |
|
Q8 |
Did you or any household member go to sleep hungry because there was not enough food? |
Yes/No → Frequency: rarely/sometimes/often |
|
Q9 |
Did you or any household member go a whole day and night without eating anything because there was not enough food? |
Yes/No → Frequency: rarely/sometimes/often |
Table A3. 24-hour Food Recall Form (Two Non-consecutive Days).
|
Meal Time |
Type of Food / Beverage |
Ingredients (if mixed) |
Estimated Portion Size (g/ml) |
Cooking Method |
Remarks |
|
Breakfast |
|
|
|
|
|
|
Morning Snack |
|
|
|
|
|
|
Lunch |
|
|
|
|
|
|
Afternoon Snack |
|
|
|
|
|
|
Dinner |
|
|
|
|
|
|
Evening Snack |
|
|
|
|
|
References
Akbar, A., Darma, R., Irawan, A., Mahyuddin, Feryanto, F., & Akzar,
R. (2024). COVID-19 pandemic and food security: Strategic agricultural budget
allocation in Indonesia. Journal of Agriculture and Food Research, 18,
101494.
https://doi.org/10.1016/j.jafr.2024.101494
Angeles-Agdeppa, I., Toledo, M. B., & Zamora, J. A. T. (2021). Moderate and
severe level of food insecurity is associated with high calorie-dense food
consumption of Filipino households. Journal of Nutrition and Metabolism,
2021(1).
https://doi.org/10.1155/2021/5513409
Chiemela, S. N., Chiemela, C. J., Apeh, C. C., & Ileka, C. M. (2022). Households food security and perception of food nutrition in Enugu State, Nigeria. Journal of Agricultural Extension, 26(2), 11–23. https://doi.org/10.4314/jae.v26i2.2
Clapp, J., Moseley, W. G., Burlingame, B., & Termine, P. (2022). Viewpoint: The case for a six-dimensional food security framework. Food Policy, 106, 102164. https://doi.org/10.1016/j.foodpol.2021.102164
Coates, J., Swindale, A., & Bilinsky, P. (2007). Household Food Insecurity Access Scale (HFIAS) for measurement of food access: Indicator guide. Food and Agriculture Organization of United Nations.
Derso, A., Bizuneh, H., Keleb, A., Ademas, A., & Adane, M. (2021).
Food insecurity status and determinants among Urban Productive Safety Net
Program beneficiary households in Addis Ababa, Ethiopia. PLoS ONE, 16
(9), e0256634.
https://doi.org/10.1371/journal.pone.0256634
Direktorat Gizi Masyarakat.
(2019). Tabel Komposisi Pangan Indonesia 2019
[2019 Indonesian Food Composition Table]. Direktorat Jenderal Kesehatan Masyarakat, Kementerian Kesehatan
Republik Indonesia.
https://gizi.kemkes.go.id/tabel-komposisi-pangan-indonesia-tkpi-2019/
Duffy, C., Toth, G. G., Hagan, R. P. O., McKeown, P. C., Rahman, S. A.,
Widyaningsih, Y., Sunderland, T. C. H., & Spillane, C. (2021).
Agroforestry contributions to smallholder farmer food security in Indonesia. Agroforestry
Systems, 95, 1109–1124. https://doi.org/10.1007/s10457-021-00632-8
Faoziyah, U., Rosyaridho, M. F., & Panggabean, R. (2024). Unearthing agricultural land use dynamics in Indonesia: Between food security and policy interventions. Land, 13(12), 2030. https://doi.org/10.3390/land13122030
Food and Agriculture
Organization of the United Nations. (2003). Food
energy – Methods of analysis and conversion factors: Report of a
technical workshop. https://www.fao.org/3/y5022e/y5022e00.htm
Gamage, A., Gangahagedara, R., Gamage, J., Jayasinghe, N., Kodikara, N.,
Suraweera, P., & Merah, O. (2023). Role of organic farming for achieving
sustainability in agriculture. Farming System, 1(1), 100005.
https://doi.org/10.1016/j.farsys.2023.100005
Geppert, C., da Cruz, M., Alma, A., Andretta, L., Anfora, G., Battaglia, D., Burgio, G., Caccavo, V., Chiesa, S. G., Cinquatti, F., Cocco, A., Costi, E., D’Isita, I., Duso, C., Garonna, A. P., Germinara, G. S., Bue, P. L., Lucchi, A., Maistrello, L., … Marini, L. (2024). Climate and landscape composition explain agronomic practices, pesticide use and grape yield in vineyards across Italy. Agricultural Systems, 215, 103853. https://doi.org/10.1016/j.agsy.2024.103853
Gravitiani, E., Purnomo, R. A., Hendrasuryawan, B., Rudianto, M., Sartika, R.
C., & Budiono, A. (2025). SITUPANG: A hybrid Agile-UML food
security system for enhancing regional competitiveness in Indonesia. International
Journal of Safety and Security
Engineering, 15(5), 1019–1027. https://doi.org/10.18280/ijsse.150515
Hlatshwayo, S. I., Ngidi, M. S. C., Ojo, T. O., Modi, A. T., Mabhaudhi, T., & Slotow, R. (2023). The determinants of crop productivity and its effect on food and nutrition security in rural communities of South Africa. Frontiers in Sustainable Food Systems, 7. https://doi.org/10.3389/fsufs.2023.1091333
Imran, M., Kang, H., Lee, S.-G., Kim, E.-H., Park, H.-M., & Oh, S.-W. (2025). Current trends and future prospects in onion production, supply, and demand in South Korea: A comprehensive review. Sustainability, 17(3), 837. https://doi.org/10.3390/su17030837
Janni, M., Maestri, E., Gullì, M., Marmiroli, M., & Marmiroli, N. (2023). Plant responses to climate change, how global warming may impact on food security: A critical review. Frontiers in Plant Science, 14. https://doi.org/10.3389/fpls.2023.1297569
Jeevitha, D., Chimmalagi, U., Adishesha, K., Hosamani, G. B., Vinay, T. V., & Dharmatti, P. R. (2024). Influence of planting methods on growth, yield and storage of onion (Allium cepa L.) var. Bhima Shakti. Indian Journal of Agricultural Research, 58(5), 885–888. https://doi.org/10.18805/ijare.a-6217
Kavanagh, P. H., Haynie, H. J., Kushnick, G., Vilela, B., Tuff, T., Bowern,
C., Low, B. S., Ember, C. R., Kirby, K. R., Botero, C. A., & Gavin, M. C.
(2021). Drivers of global variation in land ownership. Ecography, 44(1),
67–74.
https://doi.org/10.1111/ecog.05205
Kusumawardani, A., Laksmono, B. S., Setyawati, L., & Soesilo, T. E. B. (2021). A policy construction for sustainable rice food sovereignty in Indonesia. Potravinarstvo Slovak Journal of Food Sciences, 15, 484–496. https://doi.org/10.5219/1533
Marwanti, S., Antriyandarti, E., & Khotimah, Y. K. (2024). Determinants
of food expenditure and household income in
Gunungkidul’s Karst Region. International Journal of Design and Nature and
Ecodynamics, 19(1), 93–99.
https://doi.org/10.18280/ijdne.190111
Mazenda, A. (2021). Food policy, governance and the South African food security. Journal Global Policy and Governance, 10(2), 119–138. https://doi.org/10.14666/2194-7759-10-2-007
Mohd Tohit, N. F., Mat Ya, R., & Haque, M. (2025). Unveiling the impacts of food security on community health: A scoping review. Bangladesh Journal of Medical Science, 24(2), 307–330. https://doi.org/10.3329/bjms.v24i2.81524
Muis, A., Nurnaningsih, Suirlan, R., Achmad, N. H. D., Firdayanti, &
Baharuddin. (2025). Analysis of food sovereignty in
Indonesia:
Macroeconomic data. Research
on World Agricultural Economy, 6(2), 712–722.
https://doi.org/10.36956/rwae.v6i2.1675
Muluneh, M. G. (2021). Impact of climate change on biodiversity and food security: A global perspective—a review article. Agriculture & Food Security, 10, 36. https://doi.org/10.1186/s40066-021-00318-5
Munezero, E., Adewale, C. I., Okello, D. M., & Mugonola, B. (2023). Profit efficiency analysis of red onions production in Sironko district of Uganda. Cogent Food & Agriculture, 9(1), 2222516. https://doi.org/10.1080/23311932.2023.2222516
Omer, E., Szlatenyi, D., Csenki, S., Alrwashdeh, J., Czako, I., &
Láng, V. (2024). Farming practice
variability and its implications for soil
health in agriculture: A review. Agriculture, 14(12), 2114.
https://doi.org/10.3390/agriculture14122114
Peraturan Menteri Kesehatan Nomor 28 Tahun 2019 tentang Angka Kecukupan Gizi yang Dianjurkan untuk Masyarakat Indonesia [Minister of Health Regulation Number 28 of 2019 Concerning Recommended Dietary Allowances for the Indonesian Population]. Kementerian Kesehatan Republik Indonesia. (2019). https://peraturan.bpk.go.id/Details/138621/permenkes-no-28-tahun-2019
Rahayu, L., Astuti, R., & Soboh, R. (2024). Securing the food supply chain amid geopolitical uncertainty:
A comprehensive review. Industria:
Jurnal Teknologi Dan Manajemen Agroindustri, 13(1),
115–131.
https://doi.org/10.21776/ub.industria.2024.013.01.8
Rahmawati, N., Brahmana, I. B., & Setiawan, A. N. (2023). Efforts to deal with
menopausal symptoms in elderly people with yard management. Proceeding International Conference of Community
Service, 1(1), 65–71.
https://doi.org/10.18196/iccs.v1i1.44
Rajabzadeh-Dehkordi, M., Mohammadi-Nasrabadi, F., Nouri, M., Ahmadi, A., & Faghih,
S. (2023). Food insecurity, body mass index,
socio-economic status, and food intake in lactating and non-lactating mothers
with children under two years. BMC Nutrition, 9, 62. https://doi.org/10.1186/s40795-023-00718-9
Saidah, Z., Wulandari, E., Hapsari, H., Alamsyah, R. T. P., Carsono, N.,
Kawashima, S., & Kang, S. W. (2024). Bridging the gap: The role of
geographic proximity in enhancing seed sustainability in Bandung District. Open
Agriculture, 9(1), 20220391.
https://doi.org/10.1515/opag-2022-0391
Samim, S. A., Hu, Z., Stepien, S., Amini, S. Y., Rayee, R., Niu, K.,
& Mgendi, G. (2021). Food insecurity and related factors among farming
families in Takhar region, Afghanistan. Sustainability, 13(18),
10211.
https://doi.org/10.3390/su131810211
Singh, S., Venkateshmurthy, N. S., Brown, K. A., Maddury, A. P., Khatkar, R., Jarhyan, P., Prabhakaran, D., & Mohan, S. (2023). Agricultural and socioeconomic factors associated with farmer household dietary diversity in India: A comparative study of Visakhapatnam and Sonipat. Sustainability, 15(4), 2873. https://doi.org/10.3390/su15042873
Sudomo, A., Leksono, B., Tata, H. L., Rahayu, A. A. D., Umroni, A.,
Rianawati, H., Asmaliyah, Krisnawati, Setyayudi, A., Utomo, M. M. B., Pieter,
L. A. G., Wresta, A., Indrajaya, Y., Rahman, S. A., & Baral, H. (2023). Can
agroforestry contribute to food and livelihood
security for Indonesia’s smallholders in the climate change era? Agriculture, 13(10), 1896.
https://doi.org/10.3390/agriculture13101896
Susanawati, S., & Noviyanti, N. (2024). Supply chain efficiency of red chilies in the production center of Sleman Indonesia based on performance measurement system. Open Agriculture, 9(1), 20220294. https://doi.org/10.1515/opag-2022-0294
Thamaga-Chitja, J. M., Tamako, N., & Ojo, T. O. (2025). Implications of land ownership heterogeneity
on household food security: A case study of urban farming in
Pietermaritzburg, KwaZulu-Natal Province. Land, 14(2), 236.
https://doi.org/10.3390/land14020236
Triharyanto, E., Wijayanti, D. P., & Setyaningrum, D. (2022). Morphology, structure and potential of bulbils yield as a planting material of
onion in tropical region. Universal Journal of Agricultural Research, 10(3),
204–212.
https://doi.org/10.13189/ujar.2022.100303
Triyono, Azzahra, N. A., & Kamarudin, M. F. (2025). Factor affecting of food security in organic rice farming households: A finding in Sleman Yogyakarta, Indonesia. Asian Journal of Dairy
and Food Research, 44(1), 100–108.
https://doi.org/10.18805/ajdfr.DRF-373
Wardani, N. A. S. J. E., Jamaluddin, A., Badari, S. A. Z., Zainalaludin,
Z., Hamsan, H. H., & Samdin, Z. B. (2023). The relationship of
socioeconomic and household food security among smallholder glutinous rice famers in Langkawi, Malaysia. Malaysian
Journal of Consumer and Family Economics, 31, 637–663. https://doi.org/10.60016/majcafe.v31.24
Wijerathna-Yapa, A., & Pathirana, R. (2022). Sustainable agro-food systems for addressing climate change and food security. Agriculture, 12(10), 1554. https://doi.org/10.3390/agriculture12101554
Wudil, A. H., Usman, M., Rosak-Szyrocka, J., Pilař, L., & Boye, M.
(2022). Reversing years for global food security: A review of the food
security situation in Sub-Saharan Africa (SSA). International
Journal of Environmental Research and Public Health, 19(22), 14836. https://doi.org/10.3390/ijerph192214836
Yeleliere, E., Yeboah, T., Antwi-Agyei, P., & Peprah, P. (2022).
Traditional agroecological knowledge and practices: The drivers and
opportunities for adaptation actions in the northern region of Ghana. Regional
Sustainability, 3(4), 294–308.
https://doi.org/10.1016/j.regsus.2022.11.002
Disclaimer: The views, statements, and data presented in Agricultural & Rural Studies (A&R) reflect solely the perspectives of the individual authors and contributors, and do not represent the official positions of SCC Press and/or the editorial team. SCC Press and/or the editorial team assume no liability for any harm, injury, or damage to persons or property arising from the ideas, methodologies, instructions, or products referenced herein.